Lonely In Green: Tezos Sees 35% Weekly Spike Against Bitcoin (XTZ Price Analysis)
Tezos saw a sharp increase of 16.66% over the past week and it currently trades at $1.33. More impressively. the cryptocurrency is up by 35% against Bitcoin. Over the past month, XTZ managed to gain more than 70% and it’s the best-performing altcoin amid this rather bearish market.
Tezos is now ranked in the 14th position with a market cap of $903 million.
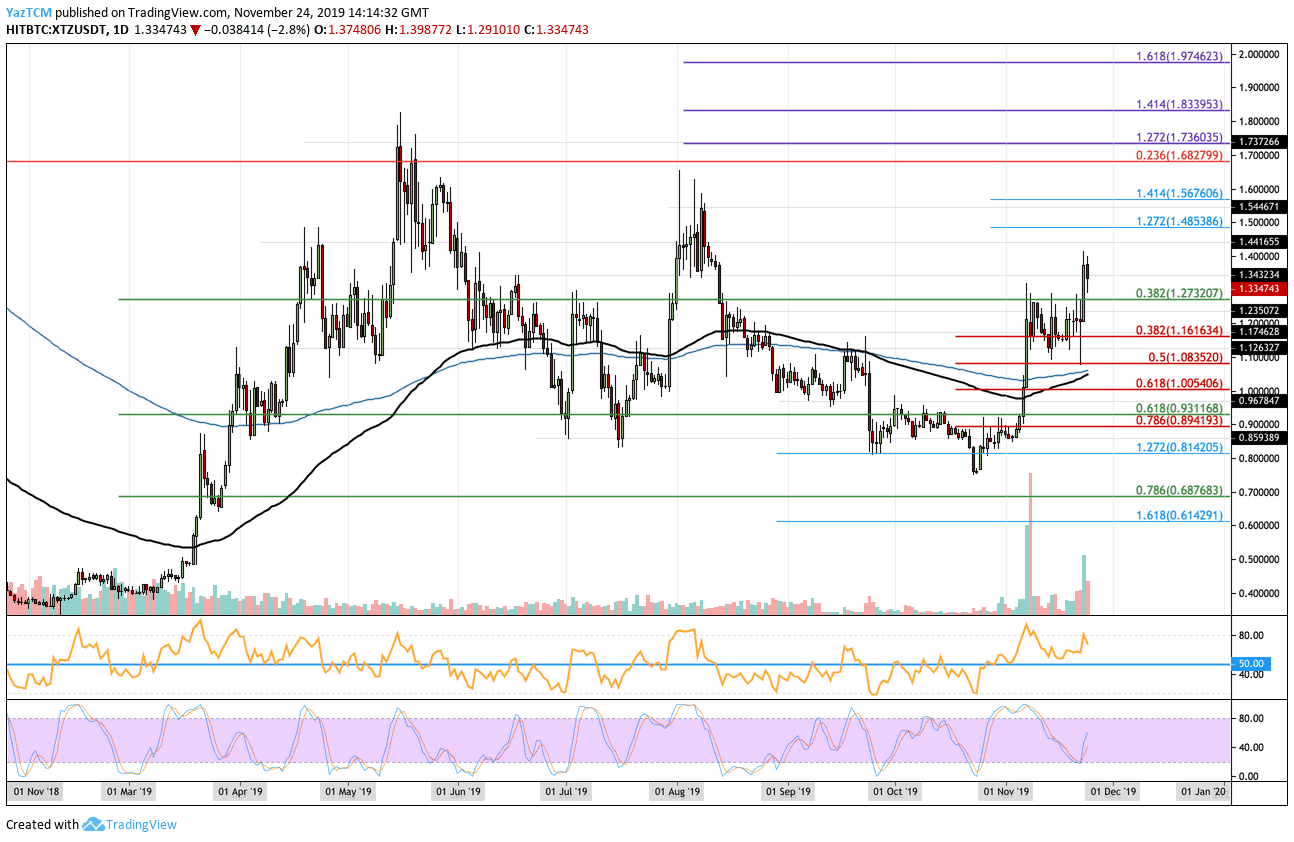
- Since our last analysis, Tezos fell below the 100-days EMA at $1.10 and continued to decrease to as low as $0.75 in October. However, after rebounding from $0.75 XTZ has surged impressively. In November, XTZ penetrated above the 200-days EMA and continued higher, breaking above the strong resistance at $1.27, to reach the current level of $1.33.
- From above: The nearest level of resistance lies at $1.40. Above this, resistance is located at $1.48 (1.272 Fib Extension), $1.56 (1.414 Fib Extension), and $1.68 (long term bearish .236 Fibonacci Retracement level).
- From below: The nearest level of support lies at $1.27. Between $1.08 and $1.00 lies strong support provided by the 100-days and 200-days EMA. Beneath $1.00, support is expected at $0.93.
- The trading volume has seen a significant rise during November 2019.
- The Stochastic RSI has recently produced a bullish crossover signal which shows that the bulls are increasing their momentum.
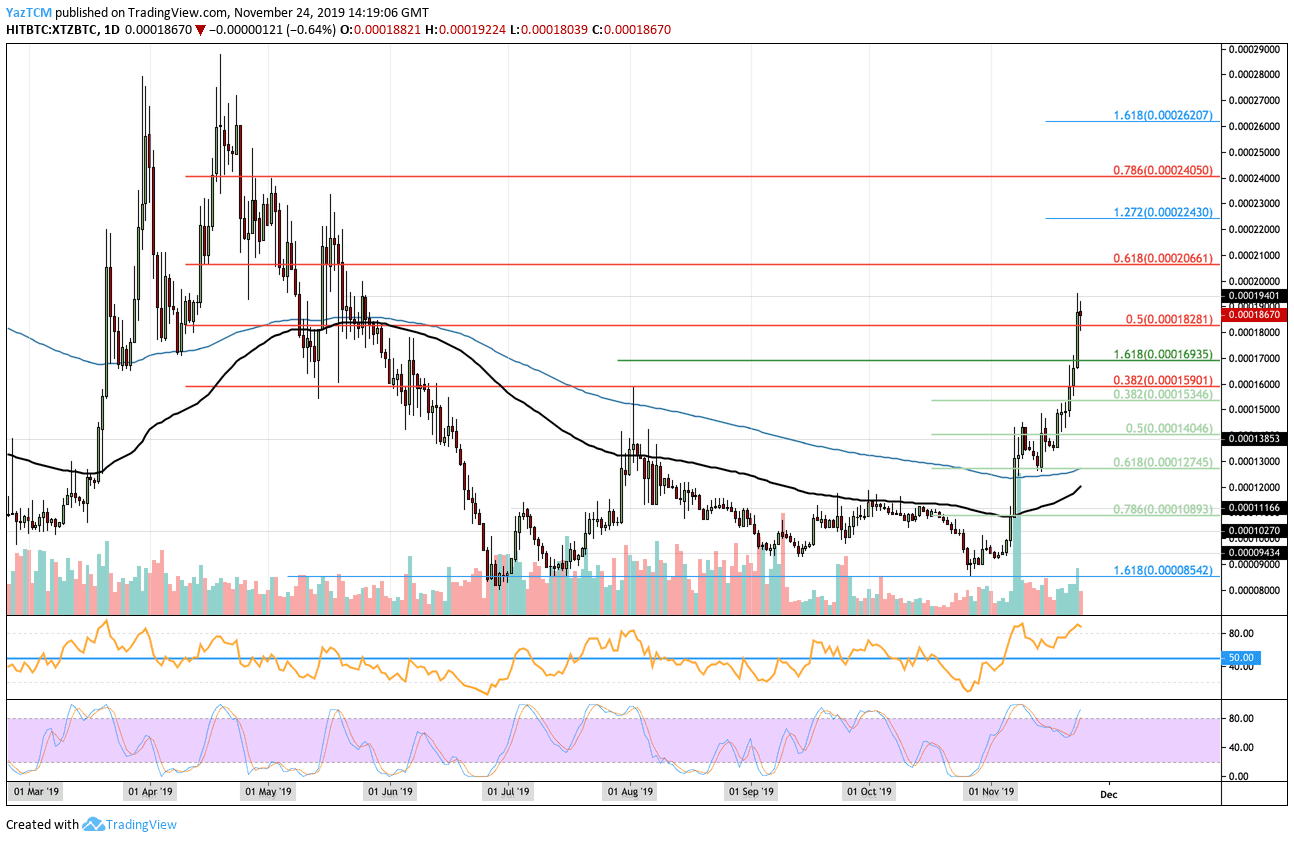
- Against BTC, XTZ pulled back from the resistance at the 100-days EMA in September 2019 and decreased all the way down to support at 0.00008540 BTC where the market rebounded. What followed was a surge above resistance at 0.0001590 BTC and 0.0001830 BTC to reach the current level of 0.0001867 BTC.
- From above: The nearest level of resistance is at 0.0001940 BTC. Above this, resistance is found at 0.00020 BTC (bearish .618 Fib Retracement), 0.0002240 BTC (1.272 Fib Extension), and 0.000240 BTC (bearish .786 Fibonacci Retracement).
- From below: The nearest level of support lies at 0.0001830 BTC. Beneath this, support is located at 0.00017 BTC, 0.0001590 BTC, and 0.0001275 BTC (200-days EMA).
- The trading volume has also risen significantly during November 2019.
- The RSI is well above the 50 level to show that the bulls dominate the market momentum. However, the Stochastic RSI is nearing overbought conditions which could be a sign that this market may need a break before heading higher.
Disclaimer: Information found on CryptoPotato is those of writers quoted. It does not represent the opinions of CryptoPotato on whether to buy, sell, or hold any investments. You are advised to conduct your own research before making any investment decisions. Use provided information at your own risk. See Disclaimer for more information.
Cryptocurrency charts by TradingView.
Technical analysis tools by Coinigy.
Source: cryptopotato.com
View original post