
Bitcoin Price Analysis: BTC Breaks Down The Wedge. Now, Will $8000 Hold?
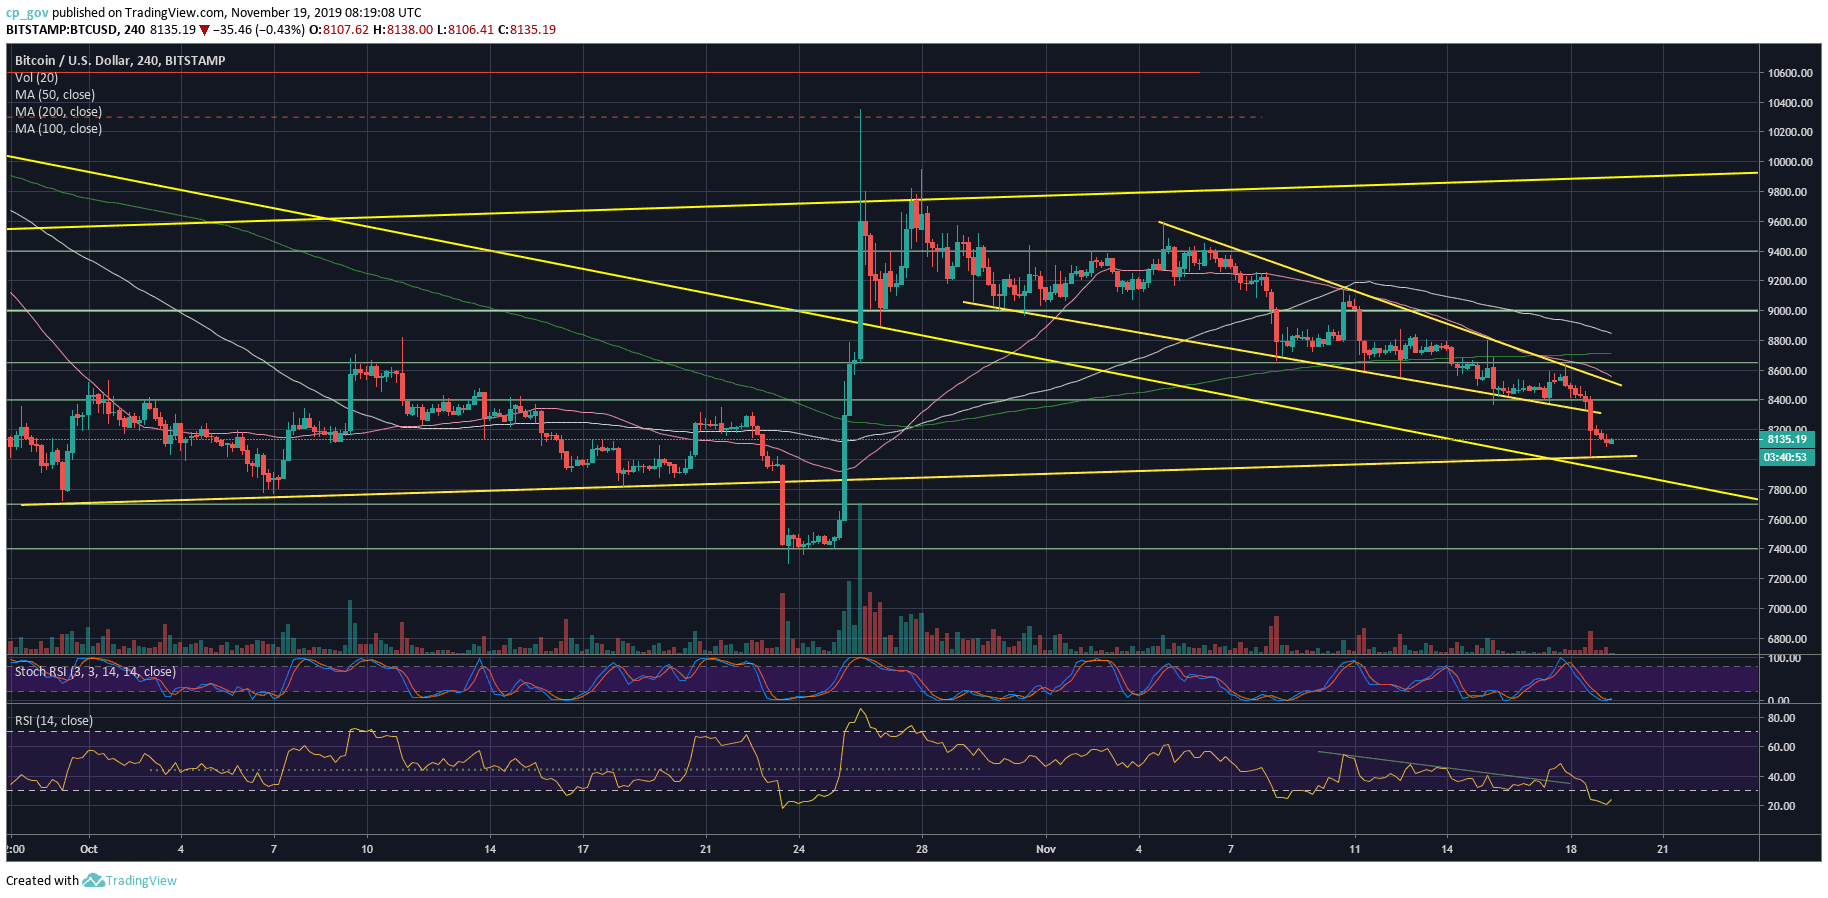
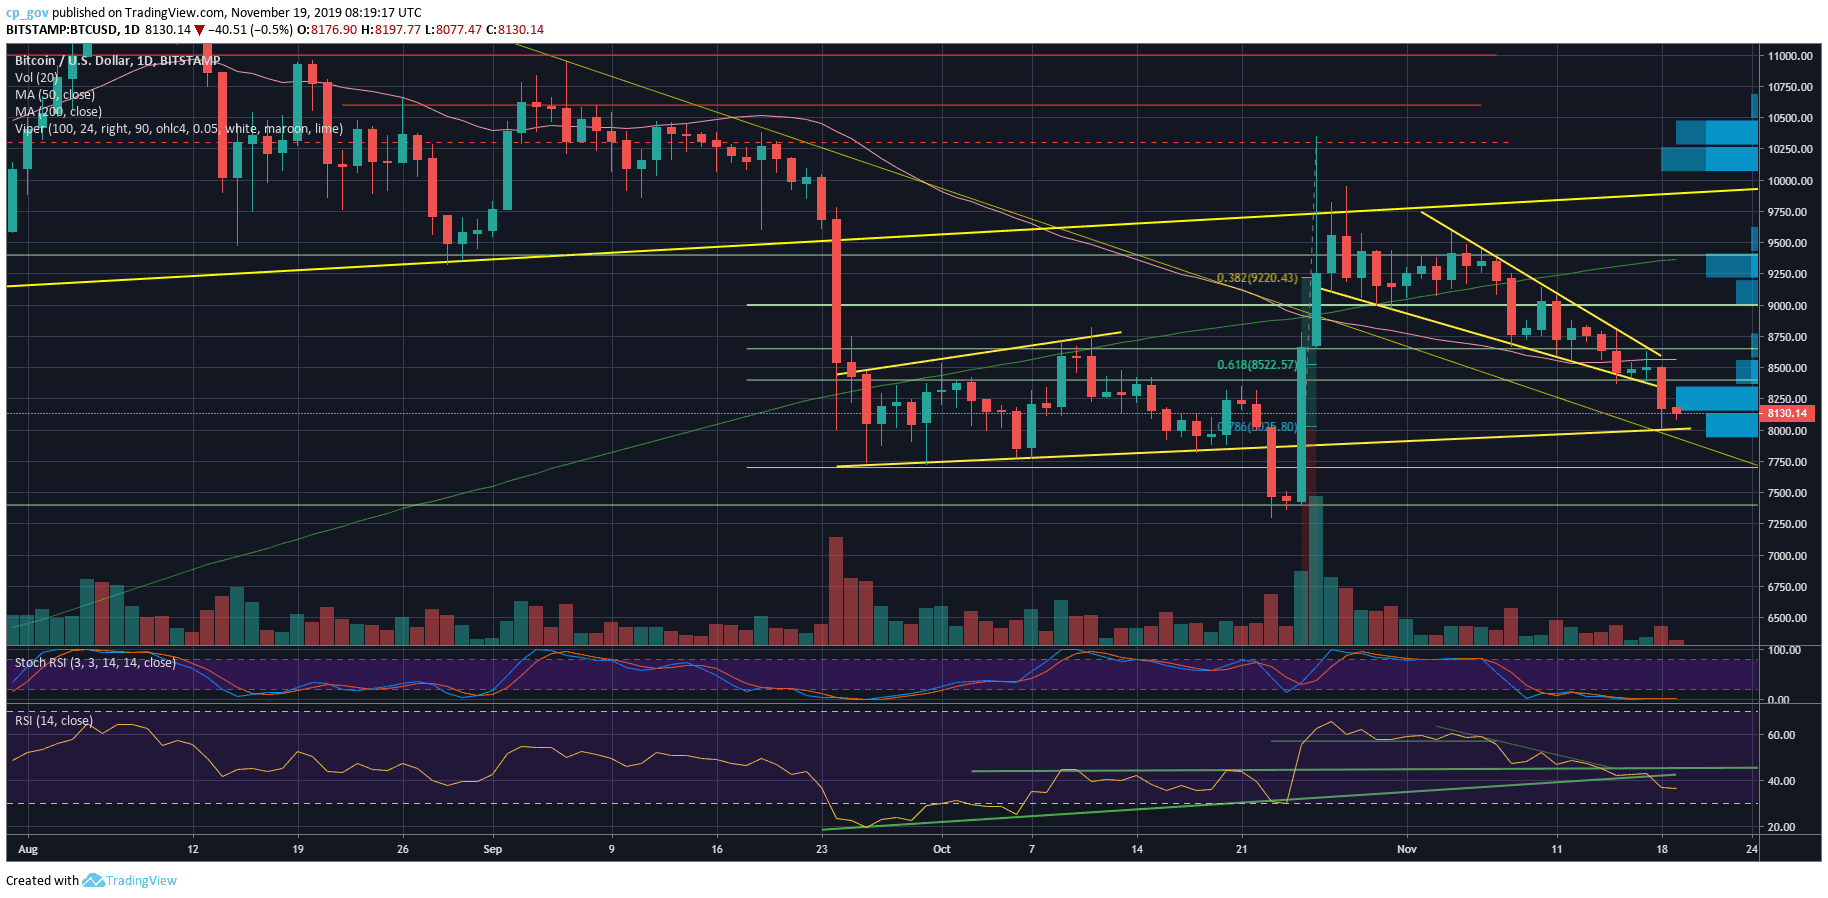
On our recent price analysis, we had discussed the colossal move that was coming up, which should have been the breakout of the wedge pattern that Bitcoin had gone through over the past three weeks.
Unfortunately, if you ask the Bulls, Bitcoin broke down violently: The coin had lost $500 from its price on the daily, marking $8010 as its yesterday’s low (Bitstamp).
We anticipated this violent move and stated that “if Bitcoin breaks down the wedge around the $8400 support, there is likely to be a quick move towards the $8000.” This is exactly what Bitcoin is up to, as of now.
The question is, if the $8K level will hold. The $8000 support is combined with the mid-term ascending trend-line, along with the 78.6% Fibonacci retracement level from the October 26 daily 42% price surge.
Total Market Cap: $224 billion
Bitcoin Market Cap: $148 billion
BTC Dominance Index: 66.1%
*Data by CoinGecko
Key Levels to Watch
– Support/Resistance: Following the breakdown of the wedge pattern, the first level of support is the $8000, which should serve as a secure demand area.
In case Bitcoin breaks down further from here, then the next support lies around $7700 – $7800. If the last doesn’t hold, then $7400 is the next target, which is Bitcoin’s lowest prices since the parabolic move of June 2019.
From above, in the likely case of a correction, Bitcoin can reach $8300 – $8400 support turned resistance as the first target (for a correction).
Further above is the $8500 area – which is the wedge’s descending trend-line, along with the 50-days moving average line (marked pink on the following daily chart).
– The RSI Indicator: Looking on the chart, the RSI tried to find support on the mid-term ascending trend-line (which started forming a month ago) but failed to do so. The line got broken and the RSI is on its way to the oversold territories.
Stochastic RSI oscillator is pointing on oversold both on the 4-hour and the 1-day chart. This can lead to a possible positive correction in the case of a cross-over.
– Trading volume: Despite the recent price action, the heavy traders hadn’t arrived yet, as the trading volume spiked, but just a little. Not something significant as of now.
BTC/USD BitStamp 4-Hour Chart
BTC/USD BitStamp 1-Day Chart
Disclaimer: Information found on CryptoPotato is those of writers quoted. It does not represent the opinions of CryptoPotato on whether to buy, sell, or hold any investments. You are advised to conduct your own research before making any investment decisions. Use provided information at your own risk. See Disclaimer for more information.
Cryptocurrency charts by TradingView.
Technical analysis tools by Coinigy.
Source: cryptopotato.com
View original post