
Cryptocurrency News
TRON Price Analysis: TRX Consolidates Above $0.20, Big Move Ahead?
TRX saw a small decrease of around 1.44% over the past 24 hours and it currently trades at $0.019. Despite this, it saw a successful month as the coin managed to surge by a total of 25%
TRX remains the eleventh-largest cryptocurrency with a market cap of $1.28 billion.
Looking at the TRX/USD 1-Day Chart:
- Since our last analysis, TRX surged higher above $0.0208 but ran into immediate resistance at $0.02206 which is provided by a long term bearish .382 Fibonacci Retracement level. After reaching this level, TRX rolled over and fell into support at $0.018723 which is provided by the short term .382 Fib Retracement (drawn in orange) and bolstered by the 100-days EMA.
- From above: The nearest level of resistance is located directly at $0.0208, where lies the 200-days EMA. Higher resistance is expected at $0.02206, $0.023, $0.024, and $0.0252 (bearish .5 Fib Retracement). Following this, resistance is found at $0.026 and $0.02730.
- From below: The nearest level of support lies at $0.0187 (100-days EMA). Beneath this, support is at $0.017977, $0.01739 (.5 Fib Retracement), and $0.01607 $.618 Fib Retracement).
- The trading volume is very low when compared with October’s trading volume.
- The RSi has recently dipped beneath the 50 level which is a bad sign for the bulls. If we would like to see TRX rebound higher from the current support, we would need to see the RSI climb back above 50 to show that the bulls are in charge of the market momentum.

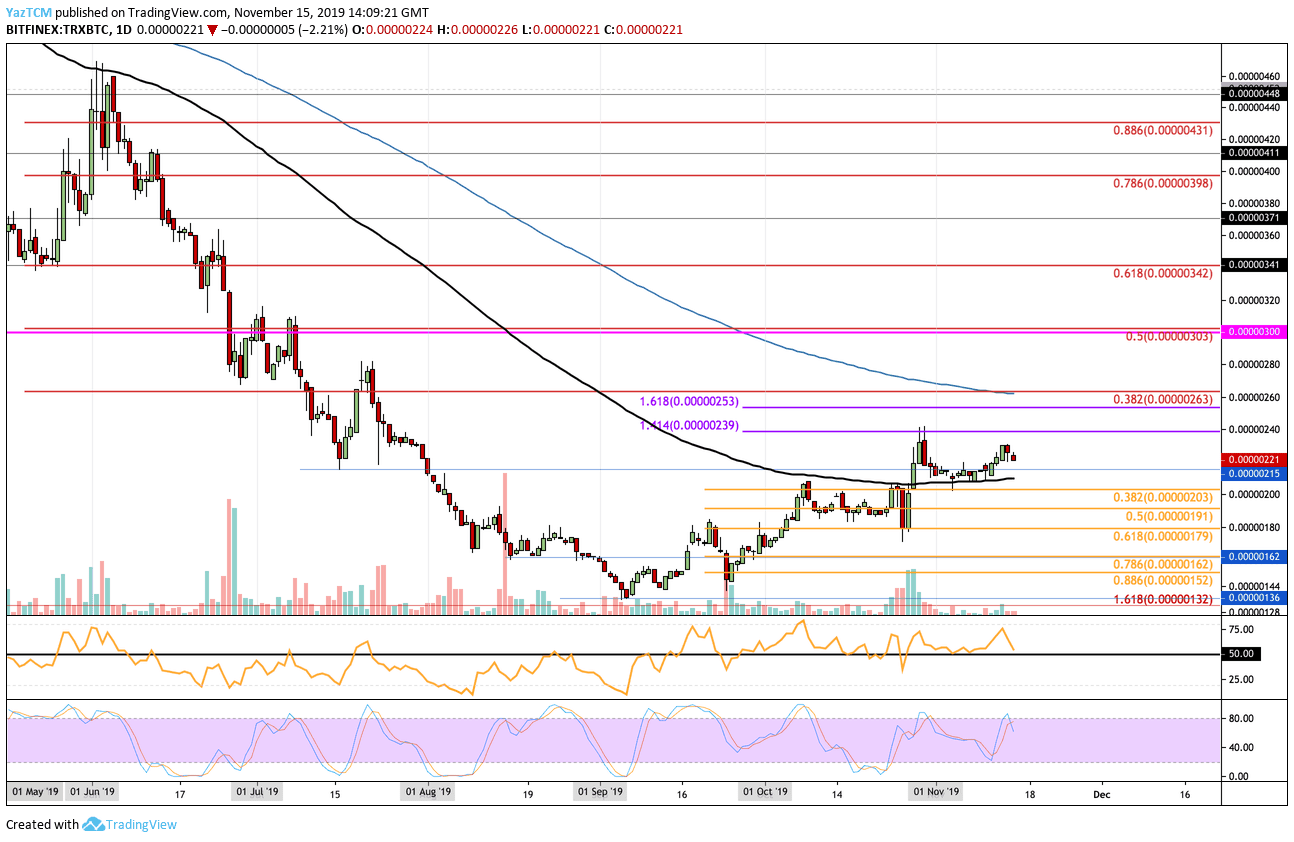
Looking at the TRX/BTC 1-Day Chart:
- Against Bitcoin, TRX climbed higher into the expected resistance at 239 SAT provided by a 1.414 Fibonacci Extension level. It has since dropped but remained supported at the 100-days EMA as it currently trades around 221 SAT.
- From above: The nearest level of resistance lies at the 239 SAT level. Above this, resistance is at 253 SAT (1.618 Fib Extension) and 263 SAT (bearish .382 Fib Retracement and 200-days EMA).
- From below: The nearest level of support lies at 215 SAT. Beneath this, support lies at 210 SAT and 203 SAT (.382 Fib Retracement). If the selling continues beneath 200 SAT, support can be found at 191 SAT (.5 Fib Retracement) and 179 SAT (.618 Fib Retracement).
- The trading volume remains extremely low during November 2019.
- The RSI has recently dipped toward the 50 level which shows that the bulls are losing control over the market momentum.
Click here to start trading on BitMEX exchange and receive 10% discount on fees for 6 months.
Disclaimer: Information found on CryptoPotato is those of writers quoted. It does not represent the opinions of CryptoPotato on whether to buy, sell, or hold any investments. You are advised to conduct your own research before making any investment decisions. Use provided information at your own risk. See Disclaimer for more information.
Cryptocurrency charts by TradingView.
Technical analysis tools by Coinigy.
Source: cryptopotato.com
View original post