Ripple Price Analysis: XRP Fails To Close Above $0.30 But Is It Plotting a Move Against BTC?
XRP saw a small increase of around 2% over the past week and it currently trades at $0.2995. The cryptocurrency still has hard times closing above the $0.30 level as each attempt so far has failed. Despite this, XRP has still seen a 12.50% price hike over the past month.
XRP remains the third-largest cryptocurrency with a market cap of $13.03 billion.
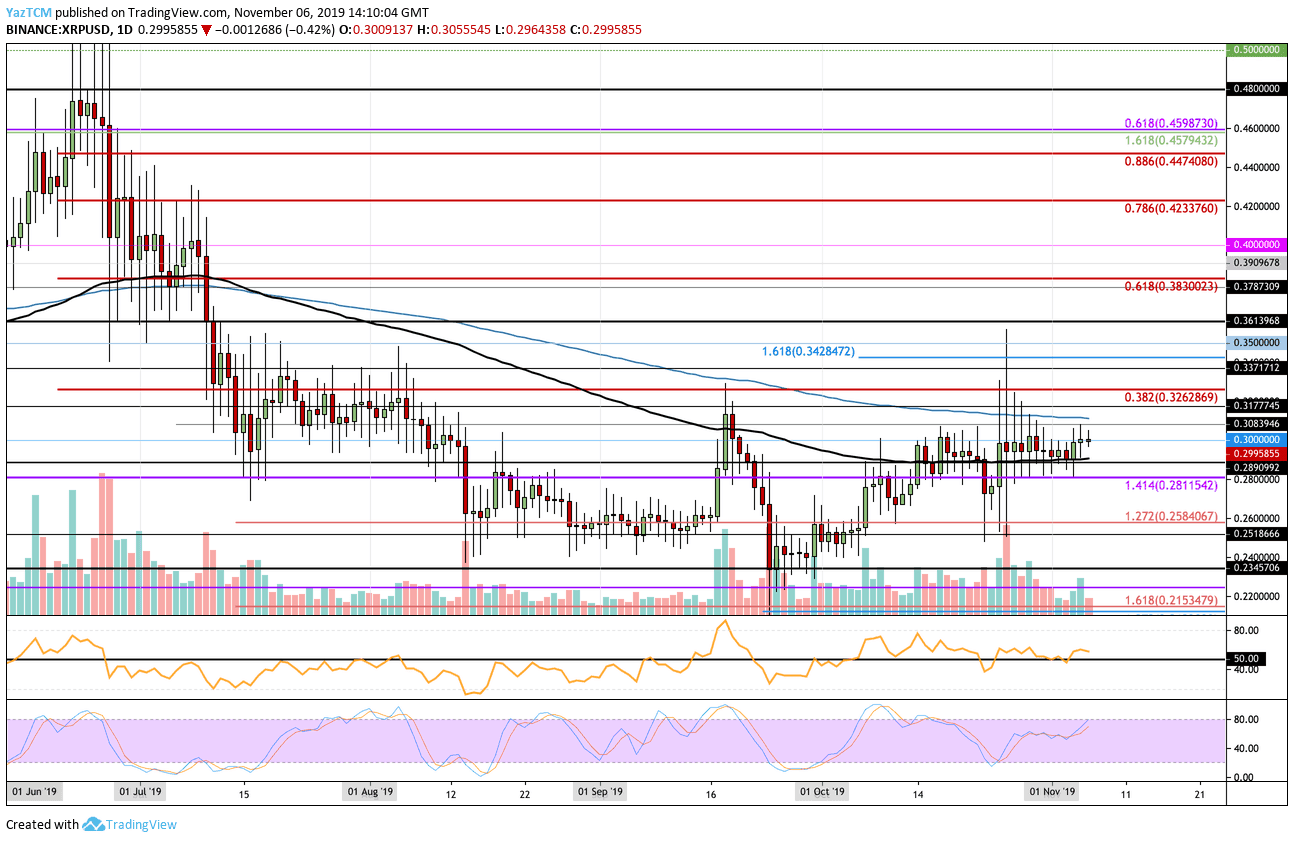
Looking at the XRP/USD 1-Day Chart:
- Since our previous XRP/USD analysis, the cryptocurrency continued to trade sideways as it remains trapped around the $0.30 level. XRP managed to rise above it during a lot of the days but pulled back to close beneath each time. It remains strongly supported by the 100-days EMA at around $0.2890.
- From above: If the bulls can close above $0.30, higher resistance lies at $0.308 and $0.31 (200-days EMA). Above this, resistance lies at $0.3177, $0.3262 (bearish .382 Fib Retracement), $0.3371, and $0.35.
- From below: The nearest level of support is found at $0.2890. Beneath this, support lies at $0.2811, $0.28, $0.27, $0.2584, $0.2518, and $0.25.
- The trading volume has diminished during the first few days of November.
- The RSI trades along the 50 level as the bulls weakly dominate the momentum. For a break above $0.30, we must see the RSI rise further higher from the 50 level.
Looking at the XRP/BTC 1-Day Chart:
- Against Bitcoin, XRP has been unable to overcome the resistance at the 3275 SAT level which is provided by the 100-days EMA. The coin remains supported by the 3112 SAT level, even though the market spiked much lower into the 3000 SAT region yesterday.
- From above: The nearest level of resistance lies at 3275 SAT. Above this, resistance is expected at 3324 SAT, 3375 SAT, 3500 SAT, and 3568 SAT (bearish .382 Fib Retracement). If the bulls continue above here, higher resistance is found at 3666 SAT, 3740 SAT, and 3834 SAT.
- From below: The nearest level of strong support lies at 3112 SAT. Beneath this, support is at 3000 SAT, 2904 SAT (short term .618 Fib Retracement), 2853 SAT (downside 1.272 Fib Ext), 2798 SAT, 2752 SAT (downside 1.414 Fib Ext), and 2710 SAT.
- The trading volume remains low but has seen an increase over the past 2 days.
- The RSI is beneath the 50 level which shows that the bears control the market momentum. However, this may be about to change as the Stochastic RSI is poised for a bullish crossover signal.

Disclaimer: Information found on CryptoPotato is those of writers quoted. It does not represent the opinions of CryptoPotato on whether to buy, sell, or hold any investments. You are advised to conduct your own research before making any investment decisions. Use provided information at your own risk. See Disclaimer for more information.
Cryptocurrency charts by TradingView.
Technical analysis tools by Coinigy.
Source: cryptopotato.com
View original post