Ripple Price Analysis
Ripple Price Analysis: XRP Struggles Despite The Recent Bitcoin Rally
XRP saw a small price increase of around 1.48% over the past week and it currently trades at $0.2975. The cryptocurrency has been relatively quiet whilst the rest of the market surged and it failed to close above the $0.30 resistance level. This is perhaps due to the fact that XRP began to fell against BTC.
Nevertheless, XRP remains the third-largest cryptocurrency with a market cap of $12.82 billion.
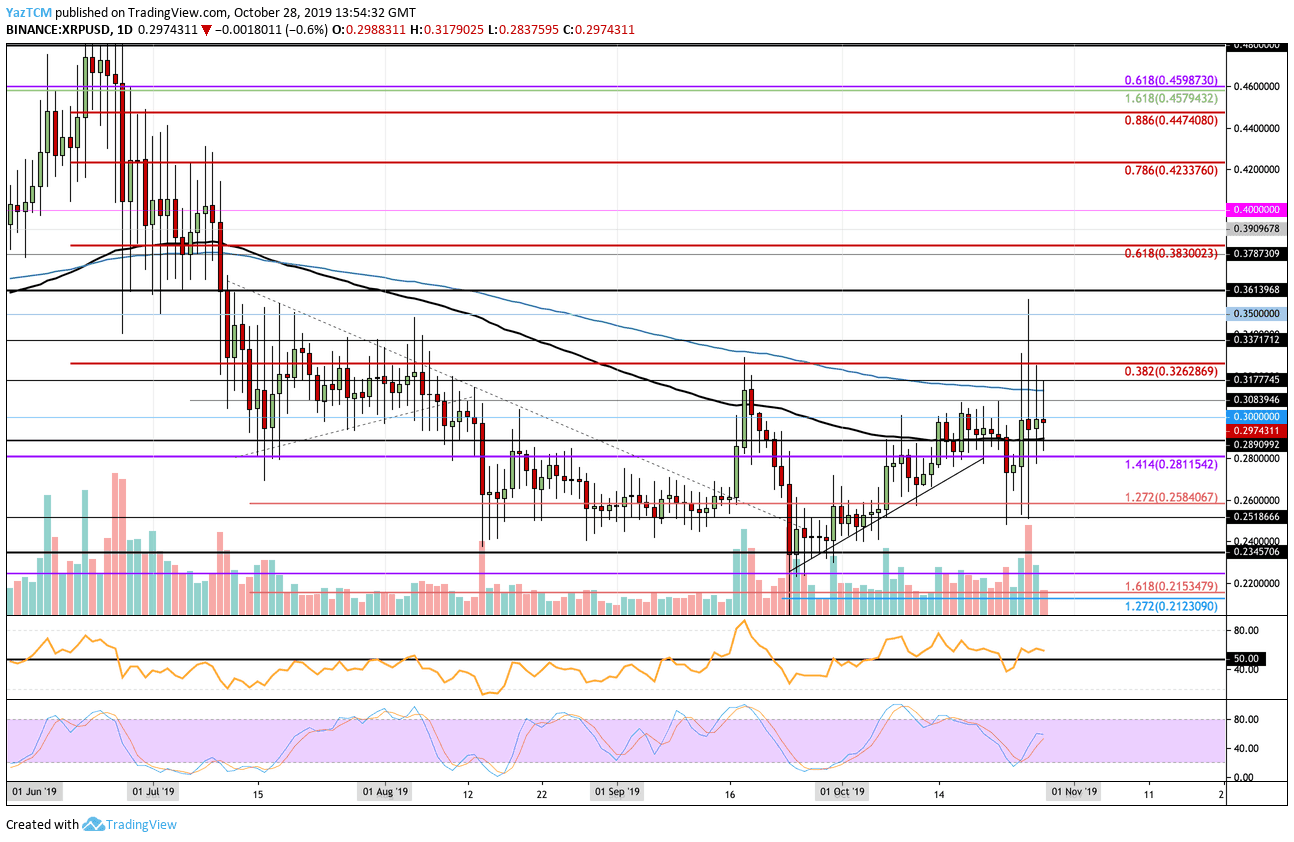
Looking at the XRP/USD 1-Day Chart:
- Since our previous XRP/USD analysis, the cryptocurrency traded sideways and it remains trapped around the $0.30 level. The cryptocurrency attempted to climb higher, being able to rise as high as $0.35 but failed to close each day above $0.30.
- From above; the nearest level of resistance lies at $0.30. Above this, resistance is located at $0.308 and at the 200-days EMA around $0.3133. Higher resistance is expected at $0.3177, $0.3262 (bearish .382 Fib Retracement), $0.3371, and $0.35.
- From below; The nearest level of support lies at $0.2962. Beneath this, support lies at $0.2811, $0.27, $0.26, and $0.2584.
- The trading volume remains at the average level for the month.
- The RSI is slightly above the 50 level to show weak bullish momentum. However, the Stochastic RSI is heading higher which could suggest we may be able to break above the $0.30 resistance soon.
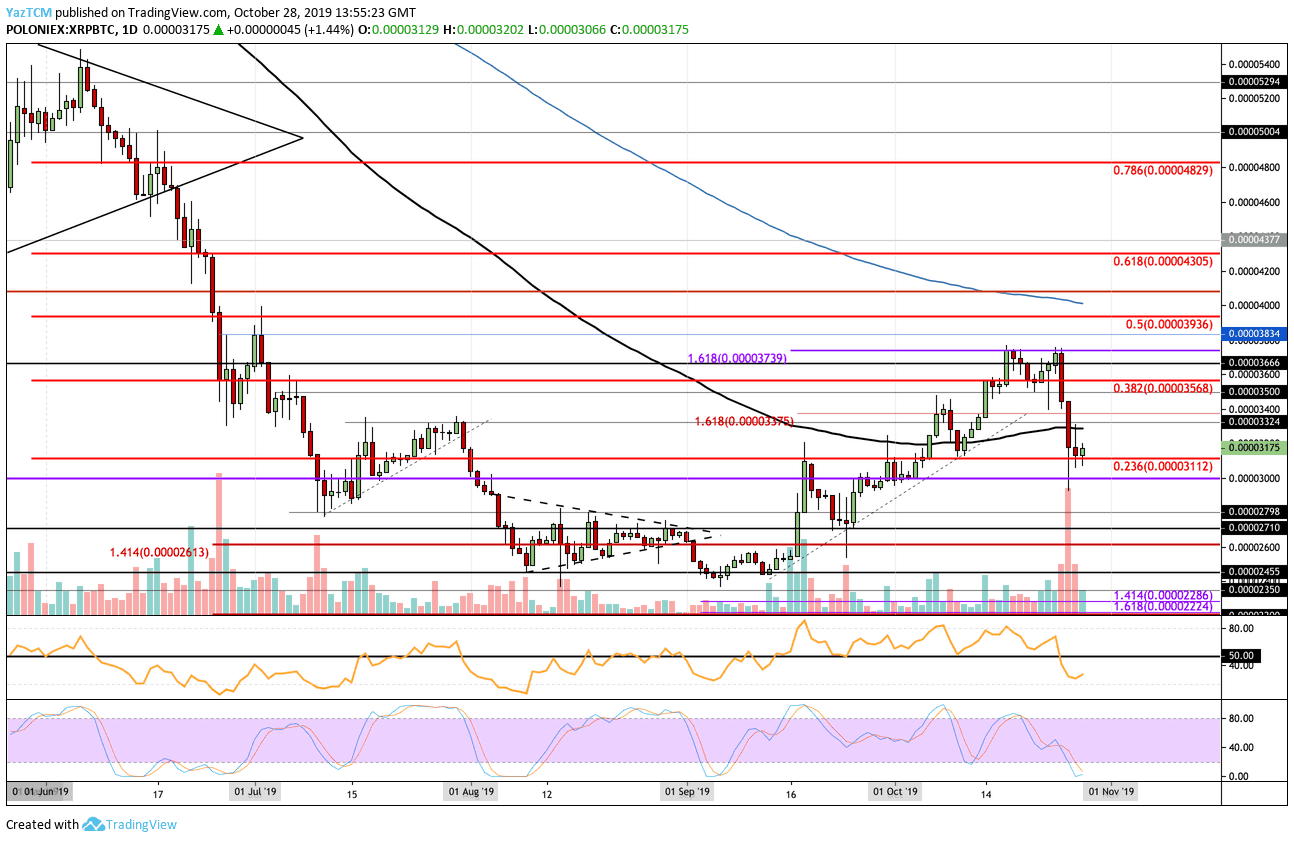
Looking at the XRP/BTC 1-Day Chart:
- Against Bitcoin, XRP double-topped at the resistance around 3740 SAT level (provided by a 1.618 Fib Extension) and rolled over to fall into previous support at around 3110 SAT.
- From above: Immediate resistance lies at the 100-days EMA at around 3290 SAT and 3375 SAT. Above this, resistance is found at 3500 SAT, 3666 SAT, and at 3740 SAT (1.618 Fibonacci Extension). Higher resistance is then expected at 3835 SAT, 4000 SAT (200-days EMA), and 4300 SAT (bearish .618 Fib Retracement).
- From below: The nearest level of support lies at 3112 SAT. Beneath this, support lies at 3000 SAT, 2800 SAT, 2710 SAT, 2600 SAT, and 2455 SAT.
- The volume has been high during the latest fall but has quietened down.
- The RSI is beneath the 50 level as the bears take control over the momentum. However, the Stocahstic RSI is posied to produce a strong bullish crossover signal which could see XRPBTC reversing pretty soon. This would certainly allow XRPUSD to break above the resistance at $0.30.
Click here to start trading on BitMEX exchange and receive 10% discount on fees for 6 months.
The views and opinions expressed above are solely those of the author and do not reflect those of CryptoPotato. You should conduct your own research before making any decision. Every investment involves serious risk.
Cryptocurrency charts by TradingView.
Technical analysis tools by Coinigy.
Source: cryptopotato.com
View original post