Ripple Price Analysis
Ripple Price Analysis: XRP Struggles At $0.30 And Rolls Over Against Bitcoin, What’s Next?
XRP saw a slight increase of around 1.59% over the past 24 hours and it currently trades at $0.2956. XRP has been back on the rise since the start of October as it managed to surge by a total of around 20%. This is perhaps largely attributed to the fact that XRP has been making some strong progress against BTC after being able to reverse at 2455 SAT and climb as high as 3739 SAT.
XRP remains the third-largest cryptocurrency with a market cap of $12.83 billion.
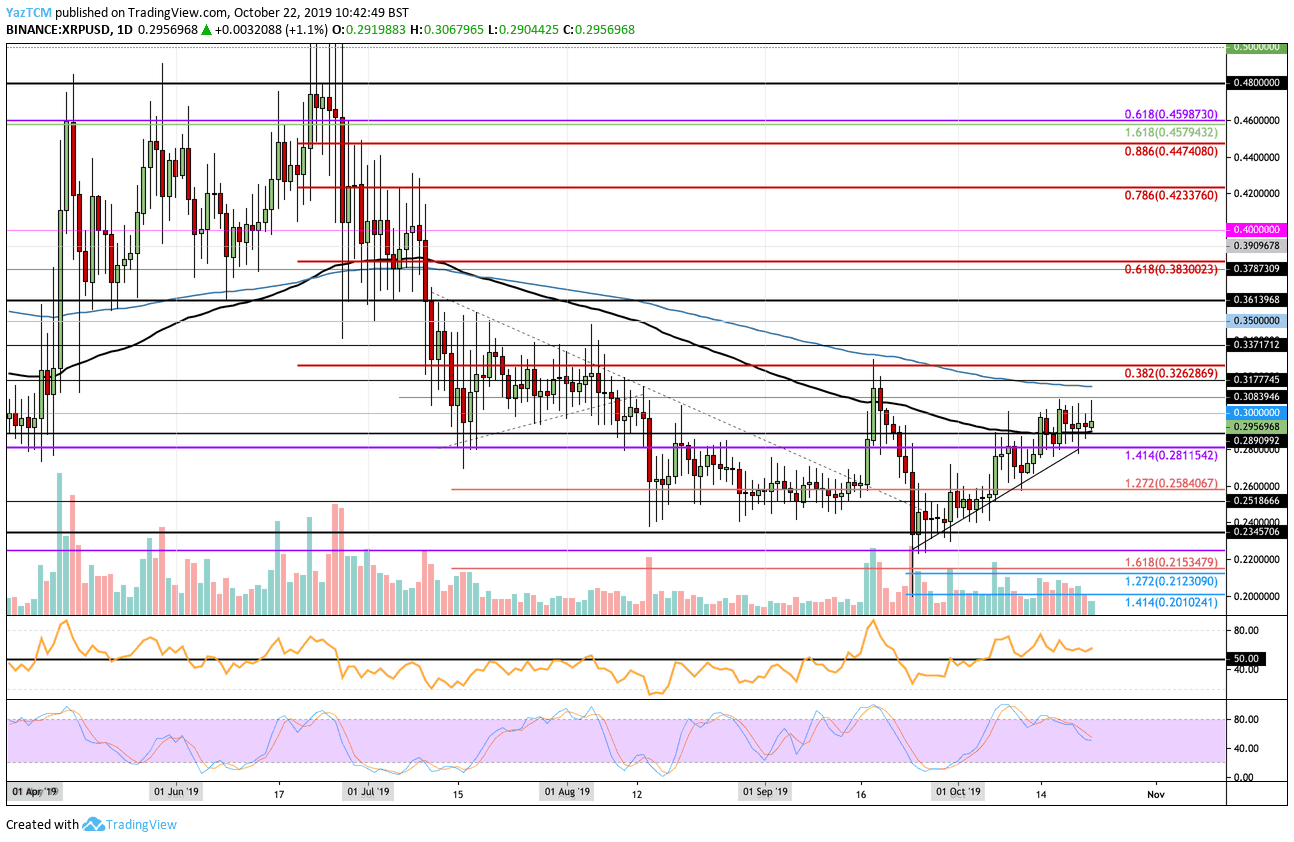
Looking at the XRP/USD 1-Day Chart:
- Since our previous XRP/USD analysis, the cryptocurrency failed to break above the resistance at $0.30. However, XRP the support at the 100-days EMA at around $0.2890 held, preventing the market from slipping any further.
- From above: The nearest level of resistance lies at $0.30. Above this, resistance lies at $0.308, $0.31 (200-days EMA), $0.3263 (bearish .382 Fibonacci Retracement level), and $0.3371. If the buying continues, higher resistance is found at $0.35, $0.3613, and $0.3830 (bearish .618 Fib Retracement).
- From below: The nearest level of support remains at the 100-days EMA around $0.2890. Beneath this, support is found at $0.2811, $0.2385, $0.2518, and $0.25.
- The trading volume remains relatively high compared to previous months.
- The RSI remains above the 50 level to show that the bulls remain in control over the market momentum. However, the Stochastic RSI is falling which is a sign that the bullish pressure may be fading.
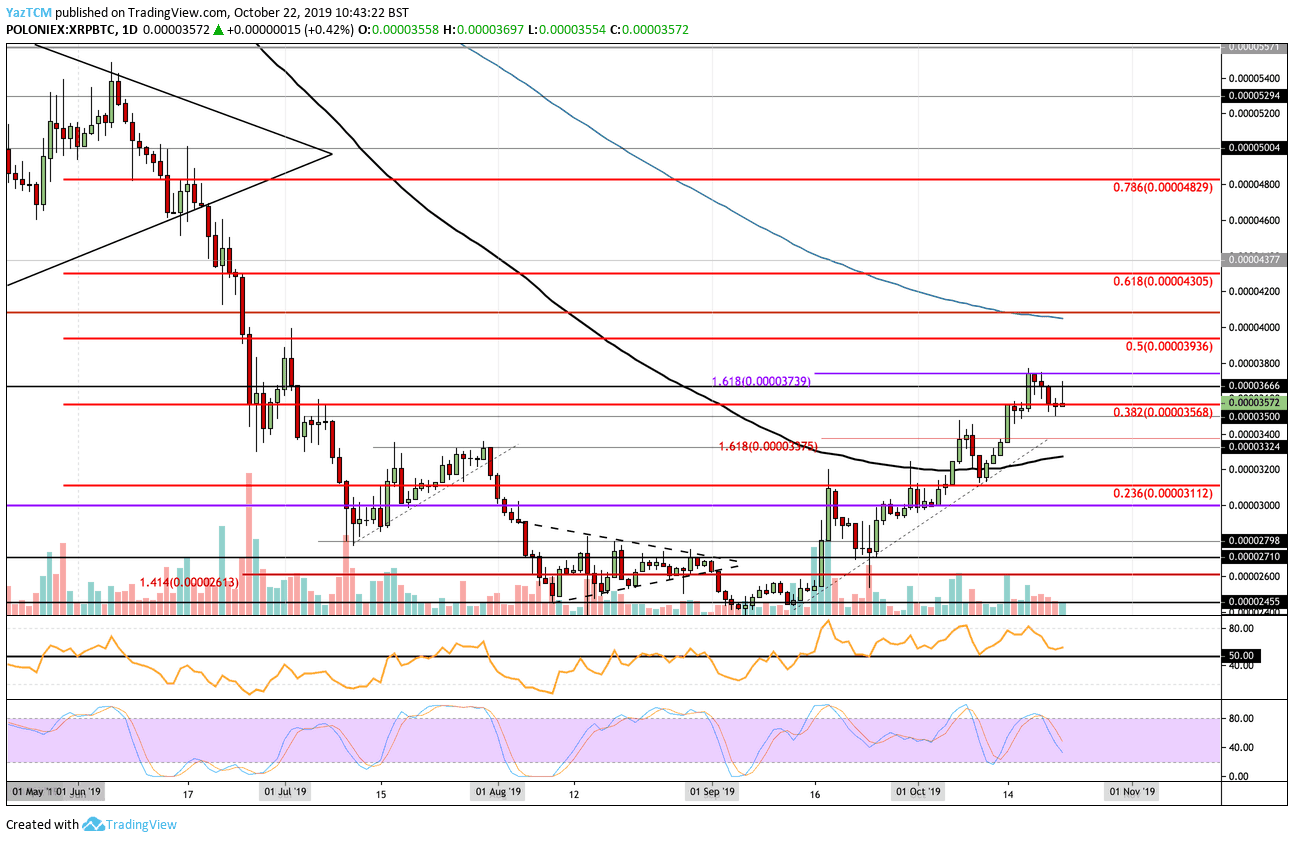
Looking at the XRP/BTC 1-Day Chart:
- Against Bitcoin, XRP failed to break above the resistance at 3739 SAT and proceeded to roll over and fall to the current trading price of around 3572 SAT. XRP remained strongly supported at 3500 SAT as the bulls attempt to push higher once more.
- From above: The nearest levels of resistance lie at 3666 SAT and 3739 SAT. Above this, higher resistance can be found at 3800 SAT and 3936 SAT (bearish .5 Fib Retracement). If the bulls crack above 4000 SAT, resistance lies at 4100 SAT (200-days EMA) and 4305 SAT (bearish .618 Fib Retracement).
- From below: The nearest level of support lies at 3500 SAT. Beneath this, support is found at 3324 SAT, 3225 SAT (100-days EMA), 3112 SAT, and 3000 SAT.
- The trading volume remains above average.
- The RSI is above the 50 level but only marginally as the bulls weakly control the momentum.
Be the first to know about our price analysis, crypto news and trading tips: Follow us on Telegram or subscribe to our weekly newsletter.
Source: cryptopotato.com
View original post