Cryptocurrency News
Binance Coin Price Analysis: BNB Plummets Below $22, but Will it Go Any Lower?
The price of Binance Coin has seen a major decline of 11.7% over the past 24 hours, as it’s currently trading at around $21.90. The drop can largely be attributed to the 7% price decline of Bitcoin, though BNB has fallen further against BTC. Binance Coin has now declined by over 17% throughout the past week, having broken below support at the 200-day EMA.
Binance Coin is currently the seventh largest cryptocurrency by market value, with a market cap of $3.48 billion.
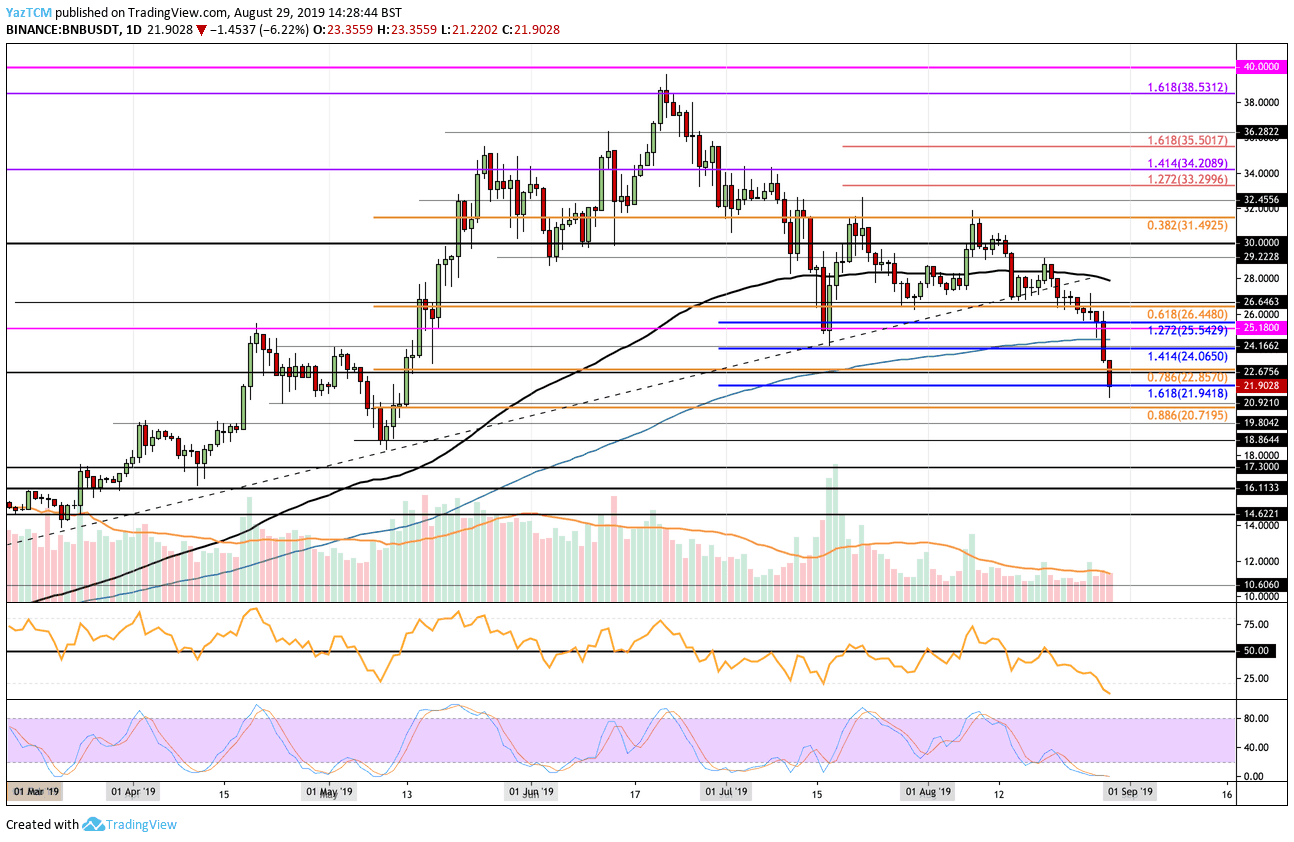
Looking at the BNB/USD 1-day chart:
- Since our previous BNB analysis, BNB has dropped below the support at $25.18 and continued to decline beneath the 200-day EMA to reach further support at $21.94 (the downside 1.618 Fib extension).
- From above: If the price climbs from here, resistance is located at $22.00 and $22.85. Higher resistance lies at $24, $25.18, and $26.44.
- From below: If the BNB price falls beneath $21.94, immediate support lies at $21, $20.71 (the .886 Fib retracement), and $20. Beneath $20, further support is located at $19.80, $19.00, $18.86, and $18.00.
- The trading volume has increased slightly during the past 24 hours but remains beneath the average level.
- The RSI has plummeted to extreme oversold conditions, a level not seen since late November 2018. As the RSI is extremely oversold, it is unlikely that BNB/USD will fall too much lower. Furthermore, the Stochastic RSI is also in extreme oversold conditions as we await a bullish crossover signal to send the market upward.
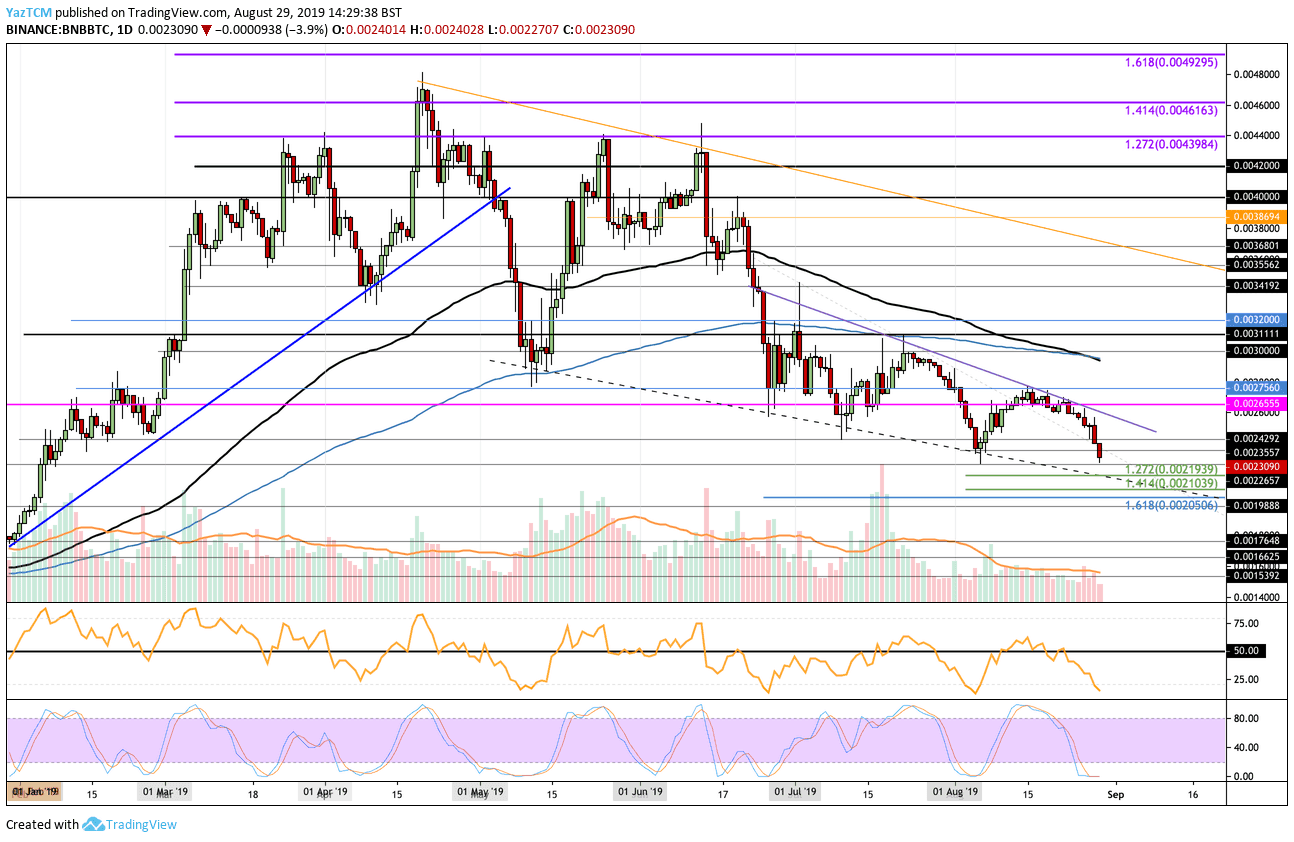
Looking at the BNB/BTC 1-day chart:
- Trading against Bitcoin, BNB has continued to fall after reaching the resistance at the upper boundary of the descending channel formation. BNB has found support at the August low of around 0.002265 BTC.
- From above: If the market can rebound, immediate resistance lies at 0.00235 BTC and 0.0024 BTC. Above this, resistance is found at 0.0025 BTC and then at the upper boundary of the falling price channel.
- From below: The nearest level of support lies at the August low of 0.002265 BTC. If the price breaks beneath this, further support is located at the downside 1.272 Fib extension level, 0.0021939 BTC. This level is bolstered by the lower boundary of the aforementioned channel. Further support is then found at 0.0021 BTC and 0.00205 BTC.
- This market’s RSI has also plummeted to extreme oversold conditions. Furthermore, the Stochastic RSI is primed for a bullish crossover signal which should send the market higher.
Be the first to know about our price analysis, crypto news and trading tips: Follow us on Telegram or subscribe to our weekly newsletter.
Source: cryptopotato.com
View original post