Bitcoin Plunges $800 In Hours: Can The Price Maintain Above $10,000? BTC Analysis & Overview
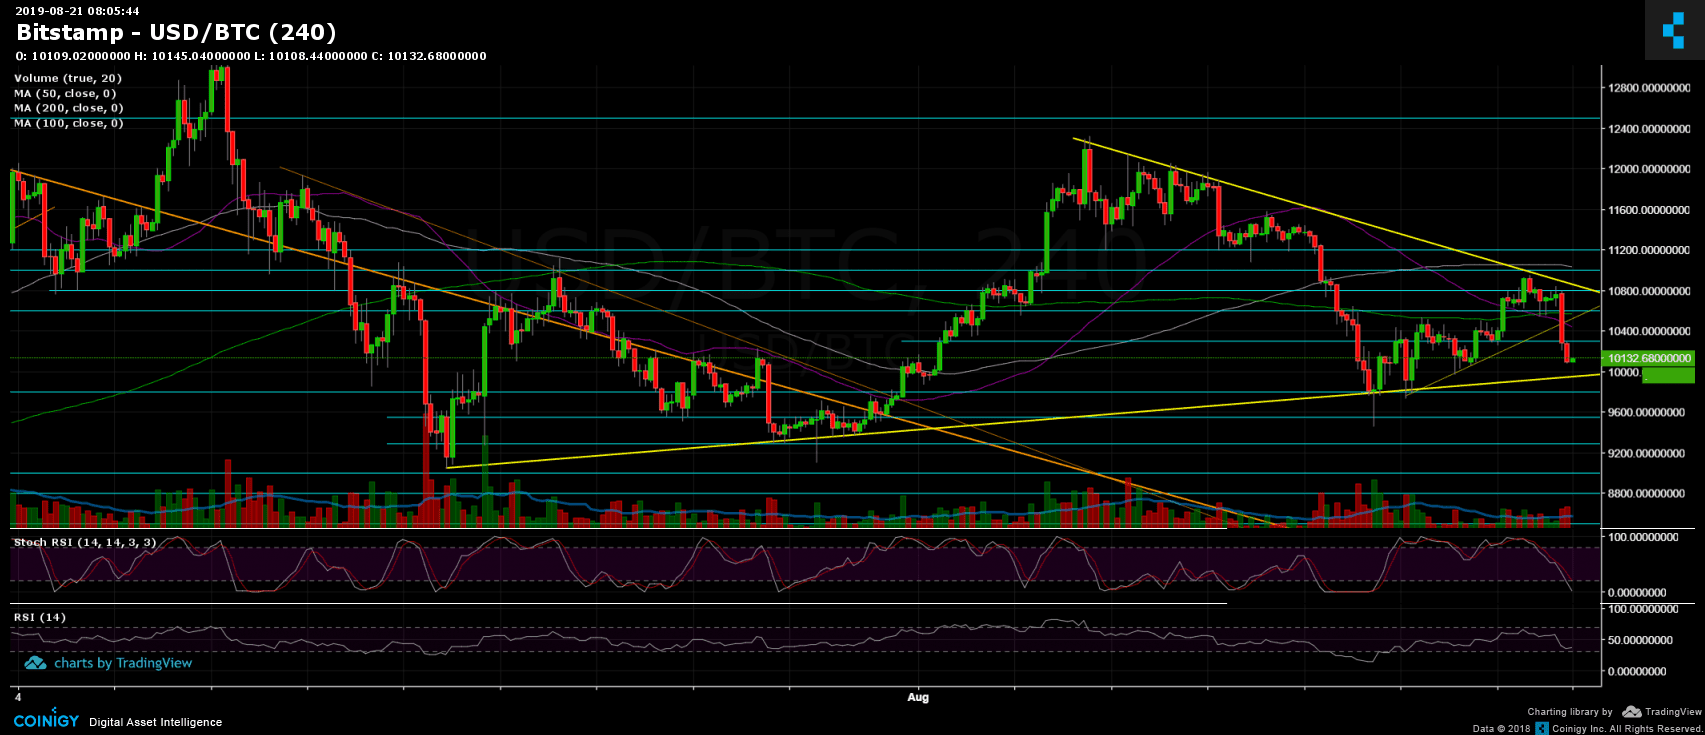
The short-term action continues going back and forth inside the marked horizontal triangle on the following 4-hour chart.
After two days of consolidation below the triangle’s descending trend-line with zero success to break through, Bitcoin plunges $800 to set $10,082 as its current daily low. As mentioned here on our previous analysis, the $10,800 area is a tough resistance, containing the 50-days moving average line (marked purple) and the 4-hour descending trend-line (marked yellow).
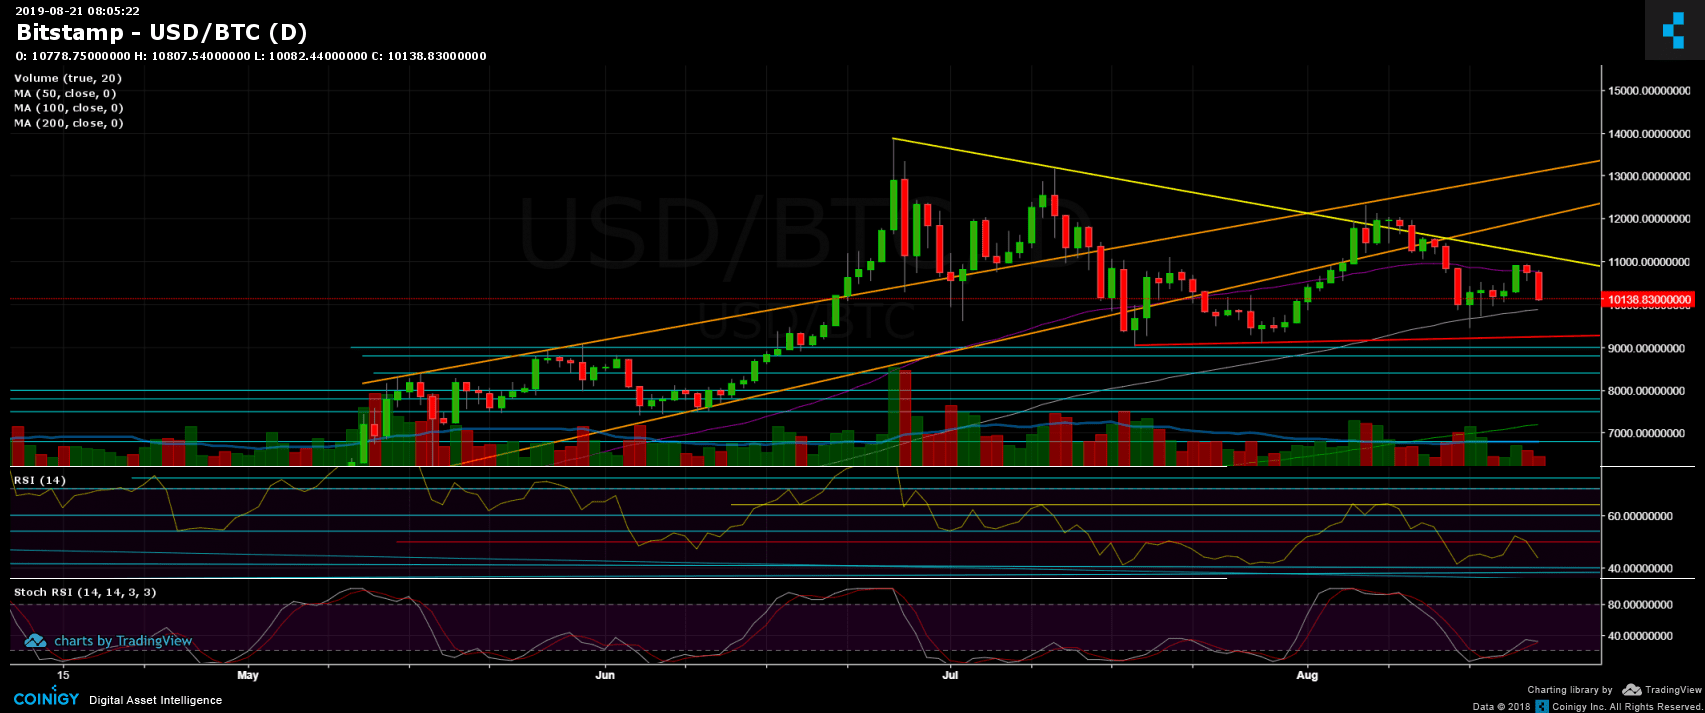
Looking at the bigger picture, the daily chart, we can see that Bitcoin had yet to produce a higher low and had been moving in a lower-high formation, which is bearish. The question is, can Bitcoin maintain the lower boundary of the triangle, which is roughly around $9950 – $10,000? That support had held the Bitcoin price for over a month.
Total Market Cap: $264 billion
Bitcoin Market Cap: $182 billion
BTC Dominance Index: 68.9%
*Data by CoinGecko
Key Levels to Watch
– Support/Resistance:
Following the recent hours’ plunge, Bitcoin is now facing the strong mentioned support level between $9800 and $10,000, along with the ascending trend-line on the 4-hour chart and the 100-days moving average line (marked white).
In case of a break-down, the next support levels to be tested are $9600 and $9300 – $9400. The last is a crucial area which contains the red ascending trend-line on the daily chart. Below is the $8800 and $8500.
From above, Bitcoin is not facing the $10,300 support turned resistance area. Further above is the $10,600 (4-hour MA-200), before getting to the $10,800 for a second chance.
– Daily chart’s RSI: The RSI indicator looks bearish after failing to maintain the 50 level and now facing the 43-44 levels in a last effort to stay above its previous low. If the RSI does succeed, it might be a first bullish sign that the price could indeed remain above the $10,000 region and that the bulls are still here.
– Trading Volume: So far, we are witnessing one of the lowest volume weeks since April. Maybe typical to July and August, but this amount of volume could be enough to move the whole Bitcoin market.
BTC/USD BitStamp 4-Hour Chart
BTC/USD BitStamp 1-Day Chart
Source: cryptopotato.com
View original post