
Cryptocurrency News
Ripple Price Analysis: XRP Drops Below $0.30 But Are Their Signs Of Rebound?
XRP has continued to slide this week after dropping by a total of 7% to bring the price for the coin below $0.30 and it’s currently trading at $0.2933. The latest decrease caused XRP to drop beneath a consolidation pattern as the bulls scramble to bring XRP back above the $0.30 level.
XRP remains the third-largest cryptocurrency with a market cap of $12.65 billion. The latest price declines are largely due to XRP falling against BTC. However, there is some hope on the horizon as the bulls potentially poise themselves for a push higher.
Looking at the XRP/USD 1-Day Chart:
- Since our previous XRP/USD analysis, we can clearly see XRP falling beneath the symmetrical triangle consolidation pattern that we tracked. The cryptocurrency dropped to as low as $0.28 in today’s trading session but the bulls have since stepped back in to drive XRP higher.
- From above: The nearest level of resistance lies at $0.30 which has provided very strong support during 2019. Above $0.30, resistance lies at $0.3177, $0.3371, and $0.35. The resistance between $0.35 and $0.36 is bolstered by both the 100 days and 200 days EMAs being located here.
- From below: If the sellers close the market beneath the $0.30 level we could be seeing XRP heading lower. Initial support is expected at $0.2890, $0.2811, and $0.28. If the selling continues further, support is expected at $0.2747, $0.2687, and $0.2621.
- The trading volume remains around the average level this month.
- The RSI has plummeted toward extreme oversold conditions as the bulls remain in complete control over the market momentum.

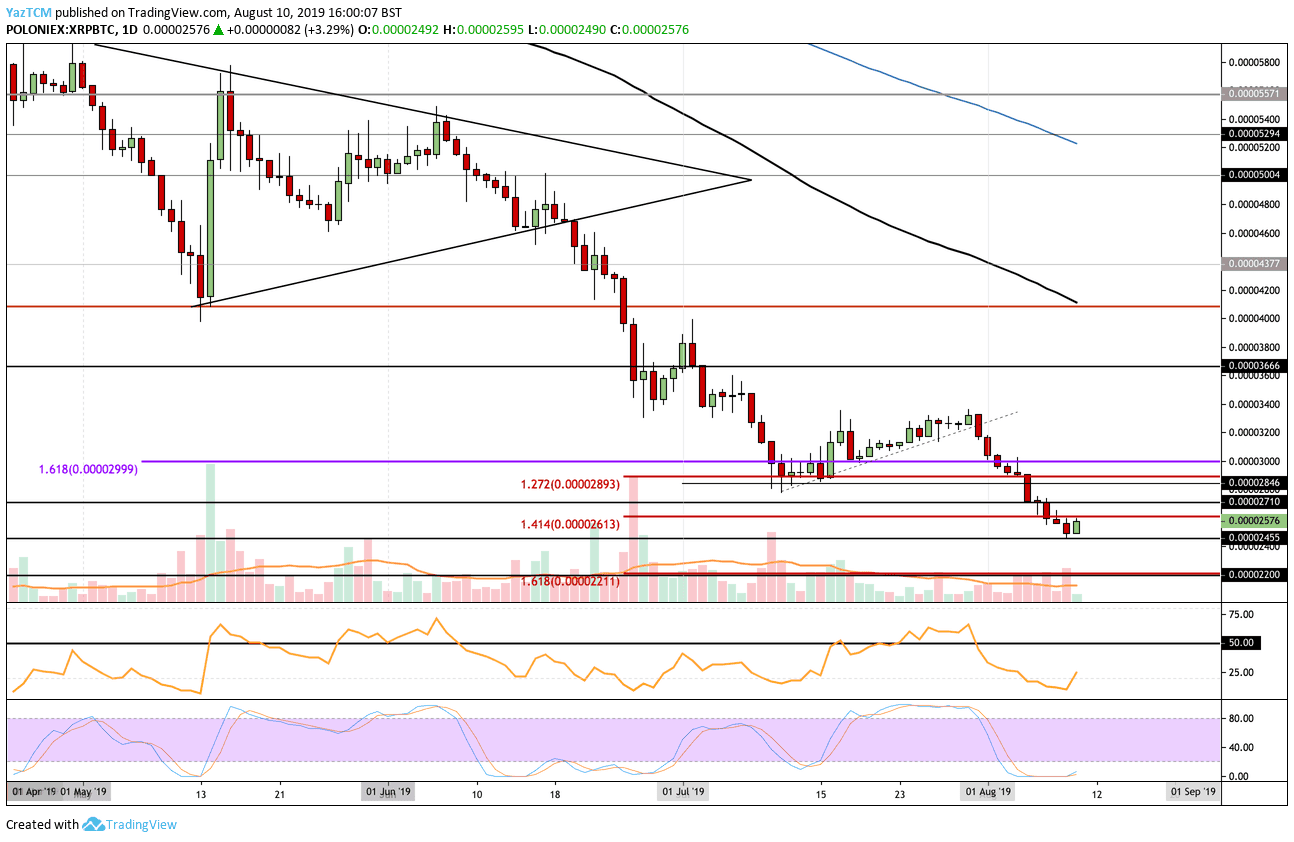
Looking at the XRP/BTC 1-Day Chart:
- Against Bitcoin, we can see that XRP has also continued to plummet beneath the support at 2613 SAT but has managed to bounce at the 2455 SAT level. If the bulls can continue to close back above 2613 SAT over the next few days, this may indicate a short term bullish rebound.
- From above: The nearest level of resistance lies at 2613 SAT. Above this, resistance lies at 2710 SAT, 2846 SAT, and 3000 SAT. If the rebound can continue to travel further above 3000 SAT, higher resistance is expected at 3200 SAT, 3400 SAT, 3666 SAT and 4000 SAT.
- From below: If the sellers push the cryptocurrency lower we can expect immediate support at 2455 SAT. Beneath this, further support can be located at 2400 SAT and 2211 SAT.
- The RSI has rebounded from extremely oversold conditions which suggest that the selling momentum has started to diminish. Furthermore, the Stochastic RSI has also produced a bullish crossover signal as we wait for the moving averages to expand away from each other.
Be the first to know about our price analysis, crypto news and trading tips: Follow us on Telegram or subscribe to our weekly newsletter.
Source: cryptopotato.com
View original post