

As bitcoin price is showing some early signs of a possible recovery, let’s take a look at three popular valuation metrics for bitcoin to better understand the current situation in the market.
NVT Ratio
The Network Value to Transactions (NVT) Ratio for Bitcoin is now at 77.4. This is within the range that could be considered normal for bitcoin, and the figure has consolidated around the 57-78 range this year.
According to this metric, bitcoin is therefore fairly priced at the moment relative to the activity on the network:
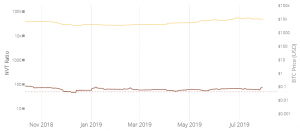
The NVT ratio was originally conceived by the popular bitcoin analyst Willy Woo, inspired by the common stock market indicator known as Price/Earnings (PE). In NVT, the total value of transactions on the bitcoin network is used as a proxy for a company’s earnings in the stock market, thus representing what a fair value should be. Similar to the PE of a company, a high NVT ratio would indicate that the cryptocurrency is overvalued. However, it does not account for off-chain transactions which might give a false sense of being overbought.
NVT Signal
Based on the standard NVT Ratio, the NVT Signal (NVTS) is a metric with some tweaks to make it more responsive and useful for short-term traders than the slow-moving NVT ratio.
At a NVTS value of 68.9, the bitcoin price is well within what could be considered normal territory, meaning a NVTS reading anywhere between 45 (below is ‘oversold’) and 150 (above – ‘overbought’).
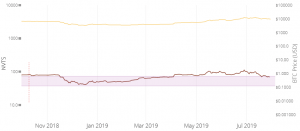
This year, however, bitcoin’s NVTS value has mostly been in the 60 to 65 range. Still, the current reading makes sense given that the bitcoin price is now close to the highest levels of the year.
Market Value to Realized Value
Bitcoin’s Market Value to Realized Value (MVRV) ratio currently sits at c. 2.2, suggesting that bitcoin is neither overvalued or undervalued.
Although this is in the upper end of its normal range, the ratio is still far from levels seen during previous market tops. For example, the MVRV ratio reached 4.4 during the peak in late 2017. However, in the second quarter of this year, this ratio more than doubled due to the market rally.
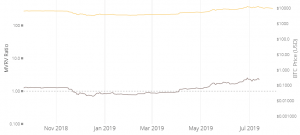
MVRV is an interesting metric mainly because it attempts to provide a more accurate valuation of a crypto network than the traditional market capitalization figure does.
Instead of taking the last traded price and multiplying it by the number of circulating coins (market capitalization), MVRV sums up the market value of all circulating coins at the time they last moved on the blockchain. The ratio is thus a better representation of the actual price that investors have realized, rather than a theoretical representation of what the coins could be worth, as is the case with market capitalization.
Source: cryptonews.com
View original post