Cryptocurrency News
Ethereum Price Analysis: ETH Breaks Above $230 But Creates Fresh 29-Month Lows Against Bitcoin
Ethereum is showing strength against the USD, increasing by 6 percent in the past 24 hours and it’s currently trading at $235. However, looking at its performance against Bitcoin, we can see that ETH is clearly struggling.
Since the beginning of July this year, the cryptocurrency lost about 30% of its value against BTC. In the few short days of August, it lost around 9 percent. At the time of this writing, it trades at 0.0197BTC, creating fresh 29-month lows.
Ethereum remains the second-largest cryptocurrency with a market cap of $24.98 billion.
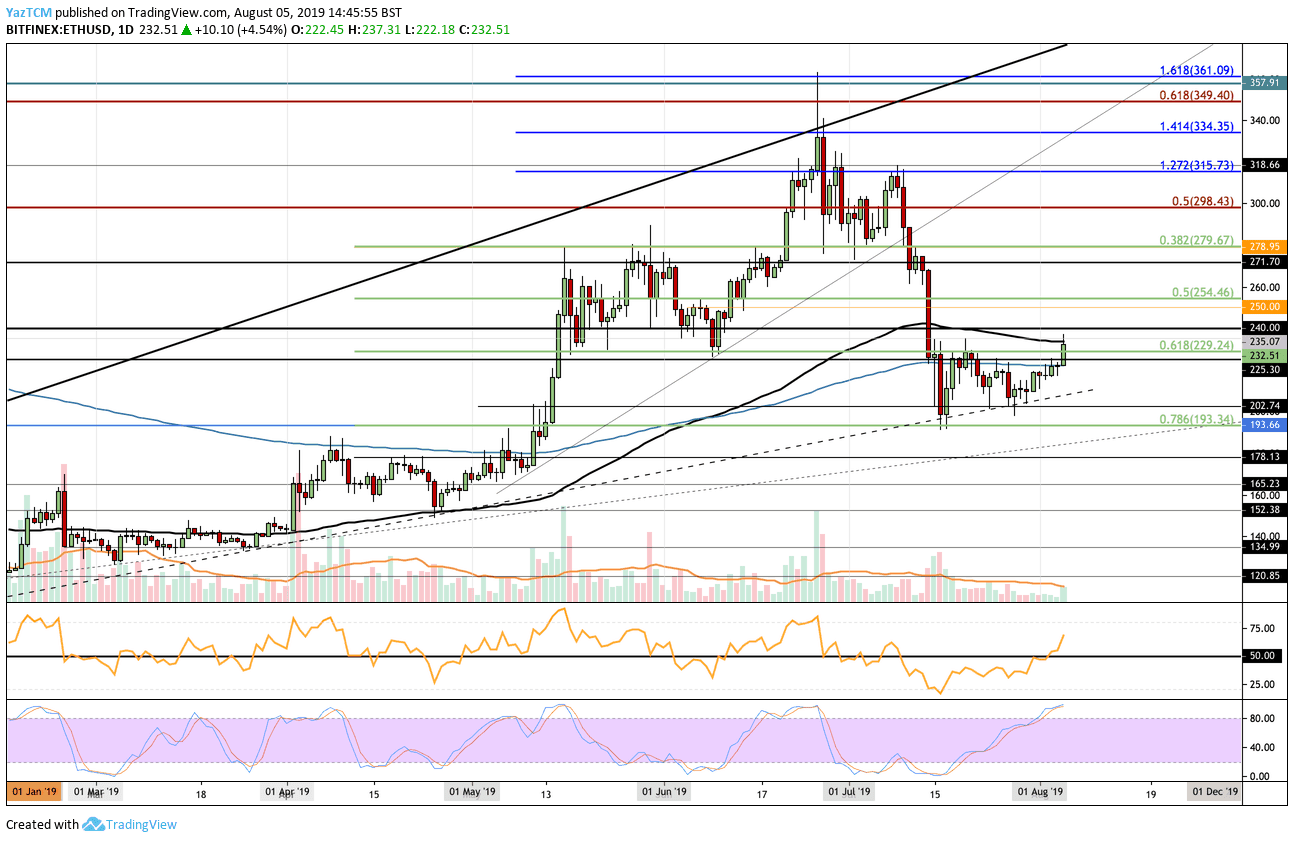
Looking at the ETH/USD 1-Day Chart:
- Since our previous ETH/USD analysis, we can see that Ethereum managed to break above the $220 and $230 resistance areas, and has now met higher resistance at the 100 days EMA around $235 as expected.
- From above: If the bulls can break above the 100 days EMA resistance and above $240, further resistance is then expected at $250, $254, $271, and $279. If the buyers continue to push higher, the next levels of resistance located at $298.43, $315, and $334.
- From below: If the resistance at the 100 days EMA proves to be too strong, we can expect support at $230, $220 and then at the rising support trend line (dashed line). If the sellers drop the market beneath the support trend line, the next levels of support toward the downside lie at $200, $193, and $178.
- The trading volume has increased today after the massive BTC surge.
- The RSI is now strongly in favor of the bulls which is a good sign. If it can remain above the 50 level, we can expect ETHUSD to break above $230 and head toward $250.
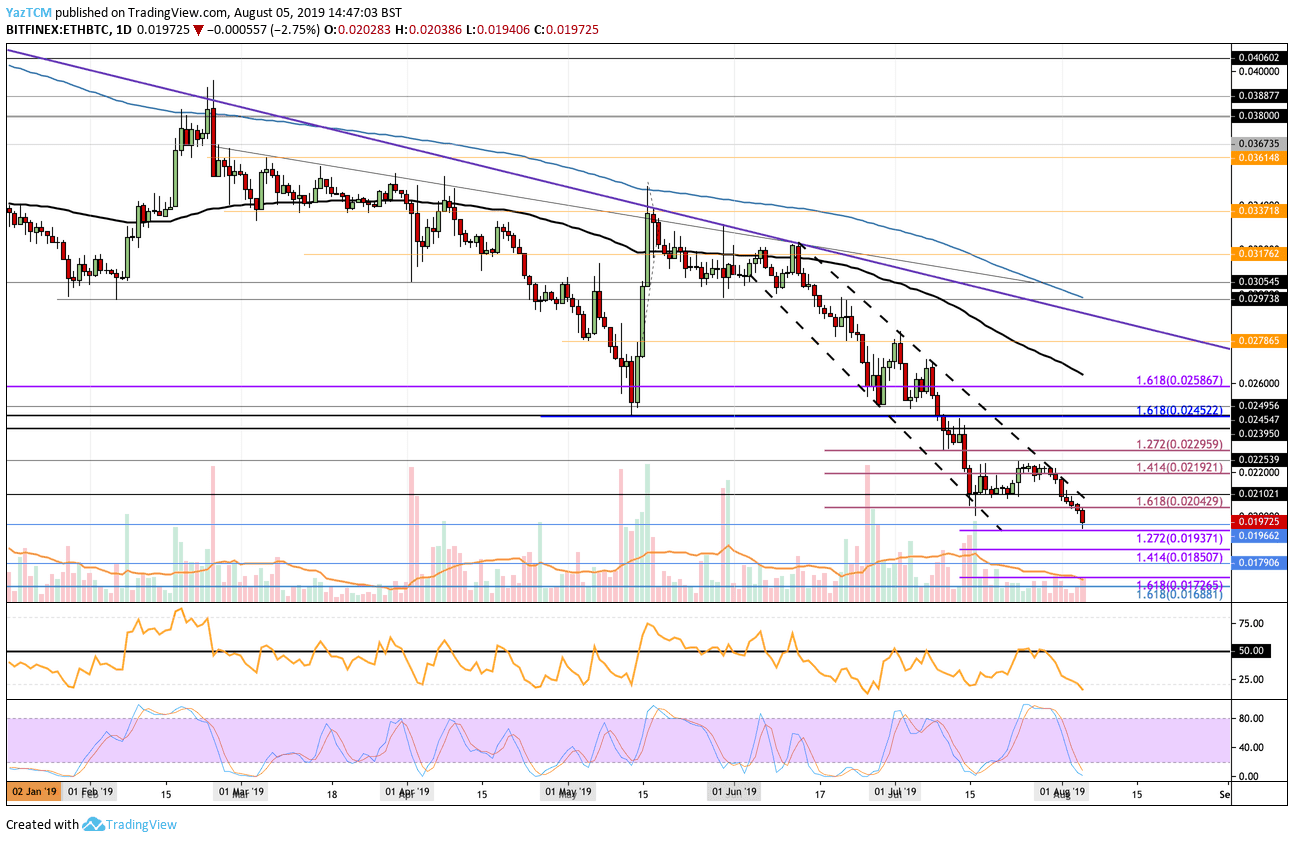
Looking at the ETH/BTC 1-Day Chart:
- Against Bitcoin, we can clearly see the struggle that ETH has gone through, particularly in the past 2 months. Etheruem had recently broken beneath the strong support at 0.021 BTC and continued to fall through the subsequent supports at 0.02049 BTC and 0.02 BTC to reach where it currently trades at around 0.019725 BTC. The case for the bulls looks very dire at this moment in time.
- From above: The nearest level of resistance lies at 0.02 BTC. This is followed with resistance at 0.0204 BTC, 0.021BTC, 0.02191 BTC, 0.0225 BTC, and 0.023 BTC.
- From below: If the sellers continue to drop the market lower, immediate support below is located at 0.01937 BTC, provided by the downside 1.272 Fib Extension. Beneath this, further support lies at 0.019 BTC, 0.019507 BTC (downside 1.414 Fib Extension), 0.0179 BTC and 0.017265 BTC.
- The trading volume has remained around the average level.
- The RSI has plummeted to extreme oversold conditions which could be a sign that the selling may be concluding soon. Furthermore, the Stochastic RSI is in oversold conditions as we wait for a bullish crossover to signal a potential move higher.
Be the first to know about our price analysis, crypto news and trading tips: Follow us on Telegram or subscribe to our weekly newsletter.
Source: cryptopotato.com
View original post