
Litecoin Price Analysis: 2 Days Before Halving, Will LTC Overcome $100?
Litecoin has seen a 2% price fall over the past 24 hours which has brought the cryptocurrency down to $95.27. Over the past few days, Litecoin had met resistance at the 100 days EMA and was unable to overcome it which had caused the market to roll over and fall. Despite the recent price drop, LTC has seen a promising week after a 6.25% increase in the price as the upcoming Litecoin block halving approaches.
Scheduled for August 5th, the Litecoin block halving will see the mining reward slash in half from 25 LTC per block to 12.5 LTC per block. This effectively reduces the influx of coins that are entering the market and thus reduces inflation. Typically, this should create a spur of buying as there is a reduced supply entering the market than previously. However, many analysts agree that the block halving has already been priced in through May-June and thus we will not see too much a pump during the halving. Nevertheless, over the long term, this should, in theory, help Litecoin as the economics of supply and demand start to head toward equilibrium once again.
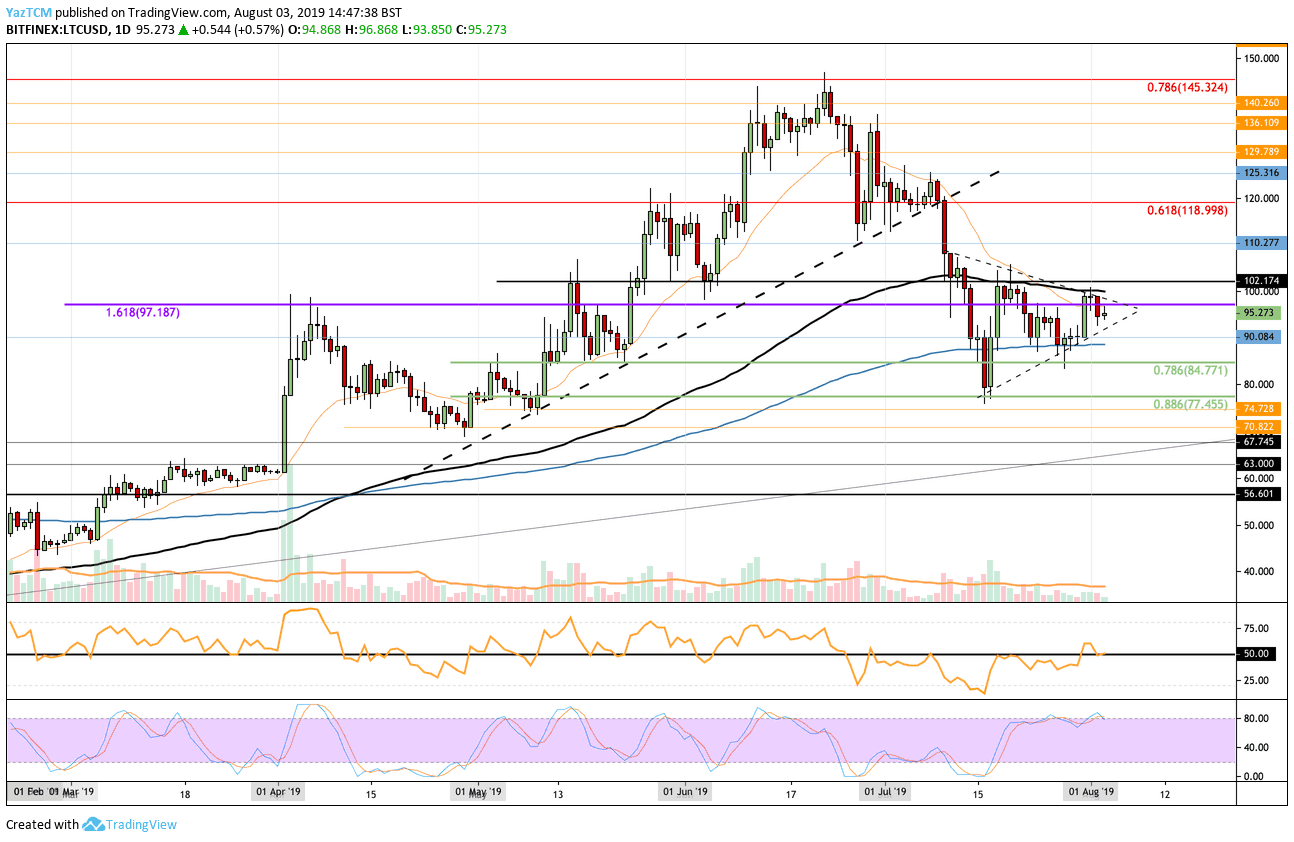
- Since our previous Litecoin analysis, LTC had managed to break above the resistance at $97.18 but failed to break above $100 due to the resistance provided by the 100 days EMA. We can see that Litecoin has dropped from this level and has now formed a symmetrical triangle consolidation pattern.
- From above: The nearest level of resistance lies at the upper boundary of the triangle which is closely followed with more resistance at $100 provided by the 100 days EMA. If the bulls can break above this congestion we can expect higher resistance at $110, $119, and $125. Above $125, further resistance lies at $136. $140, and $145.
- From below: The nearest level of support lies at the lower boundary of the pattern which is closely followed with support at $90. Beneath $90, the next levels of support lie at the 200 days EMA (around $88) and then at $84.77 (.786 Fib Retracement), and $77.45 (.886 Fib Retracement).
- The trading volume has remained very low which is quite surprising considering the halving is 2 days away.
- The RSI had managed to break above the 50 level but has dropped back toward it as the market remains indecisive of the next move. The Stochastic RSI is leaning toward the bears’ favor as it trades in overbought conditions as we wait for a bearish crossover.
- Against Bitcoin, the resistance at 0.0098 BTC was too strong, causing LTC to roll over and fall. LTC is now trading at a price of 0.0088 BTC as the cryptocurrency trends downward.
- From above: The nearest level of strong resistance lies at 0.0098 BTC which is followed with more resistance at 0.01 BTC. Above this, higher resistance is found at 0.0106 BTC, 0.0111 BTC, and 0.0113 BTC (also containing 100 days EMA).
- From below: The nearest level of support lies at 0.008244 BTC which is provided by the .886 Fibonacci Retracement. This level had also supported the market during July. If the sellers drop beneath here, further support lies at 0.00761 BTC, 0.007 BTC, and 0.006268 BTC.
- The trading volume has increased slightly during this latest round of selling.
- The RSI has plummeted back beneath the 50 level as the sellers regain control of the market momentum.

Source: cryptopotato.com
View original post