Litecoin Halving Coming Up: Can LTC Price Overcome The $100 Milestone?
Litecoin has seen a decent 6% price bump over the past 24 hours, making it the best performing coin in the top 10. It’s currently trading at around $96.35. After a 21% price fall during this month, the cryptocurrency had managed to find support at the 200 day EMA which had allowed the rebound to occur.
This recent price hike comes 4 days before the upcoming scheduled Litecoin block halving which is set to take place at block number 1,680,000. After the halving, the mining reward for Litecoin will drop from 25 LTC per block to 12.5 BTC per block which in effect reduces the inflation of Litecoin by 50%. Basic economics tells us that if the demand for it remains the same or increases, the price should go up. Of course, it’s entirely possible that the event has already been factored in.
Litecoin remains ranked in the 4th place amongst the top crypto projects with a market cap value of $6 billion.
Looking at the LTC/USD 1-Day Chart
- Since our previous Litecoin analysis, we can see that Litecoin fell back to the support at the 200 days EMA and managed to hold there. The recent 6% price hike seen today allowed LTC to break above a short term descending trend line which is a good sign for the bulls. However, the candle is yet to close to act as a confirmation that the trend line has broken.
- From above: The nearest level of resistance lies at $97.18. This level of resistance has caused problems for the market during April 2019. If the bills continue above $97.18 the next level of significant resistance lies at $100. This resistance is further strengthened by the 100 days EMA. Above $100, we can expect higher resistance at $110, $119, $135, $130, and $136.
- From below: The nearest level of support lies a $90 and $88. The support at $88 is bolstered by the 200 days EMA. Beneath $88, further support can be found at $84.77, $80 and $77.45. If the selling continues beneath $77.45, more support is located at $70, $67 and $63.
- The trading volume has started to flatten out during the latter half of the month as the selling started to decrease.
- The RSI has recently managed to penetrate above the 50 level which indicates that the bulls are in control of the market momentum now. If the RSI can close above 50 and climb higher, this will be a very strong signal for the bulls.

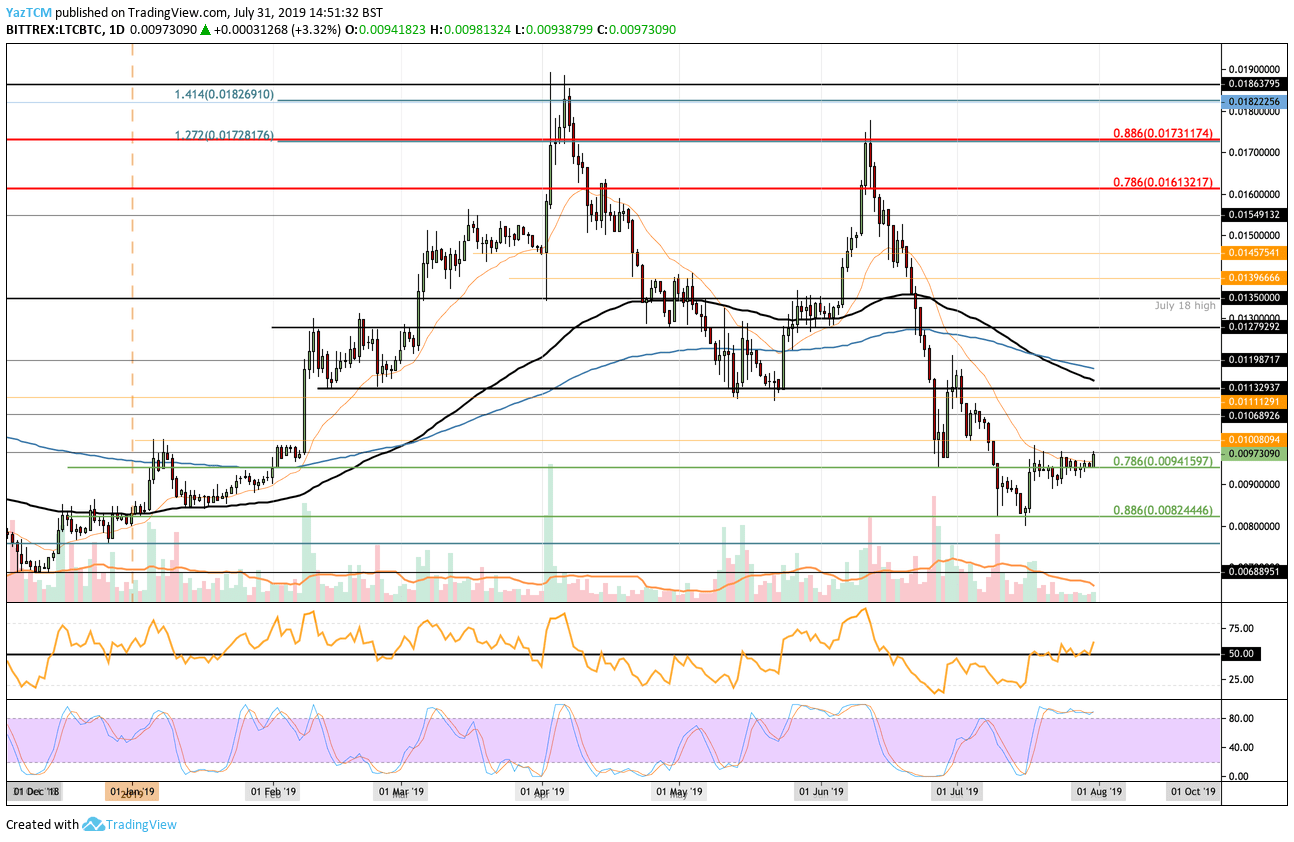
Looking at the LTC/BTC 1-Day Chart:
- Against Bitcoin, Litecoin has remained fairly static. However, we have seen an increase from 0.0094 BTC to 0.0097 BTC today – where resistance was found. The recent increase has also allowed the cryptocurrency to climb above the 21 days EMA which is a promising sign for buyers.
- From above: If the bulls can break above 0.0097 BTC, higher resistance is then located at 0.01 BTC. This is then followed with resistance at 0.0106 BTC and 0.0111 BTC. Above this lies significant resistance at the 100 days EMA and 200 days EMA at 0.0115 BTC and 0.0118 BTC, respectively.
- From below: The nearest level of support now lies at 0.0094 BTC. Beneath this, further support is at 0.009 BTC and 0.00824 BTC (provided by short term .886 Fib Retracement).
- The trading volume has remained far below the average for the past 2 weeks.
- Likewise, the RSI has broken above the 50 level which is a promising sign for the bulls as the momentum is on their side. However, the Stochastic RSI is in overbought conditions and a bearish crossover signal may push LTCBTC lower.
Source: cryptopotato.com
View original post