Cryptocurrency News
Basic Attention Token (BAT) Price Analysis: Path to Recovery Following Bounce at $0.20?
It looks like the Basic Attention Token (BAT) has started to rebound after bouncing at the $0.20 support level earlier this month and rising to around $0.2382. The cryptocurrency’s price had been ascending between February and April of this year until topping out at $0.46.
BAT has since struggled after reversing and recently broke beneath a long-term symmetrical triangle. However, there are some bullish signs for a possible reversal against BTC.
The cryptocurrency is ranked in the 35th position amongst the top crypto projects ranked by market value, as it possesses a $303 million market cap.
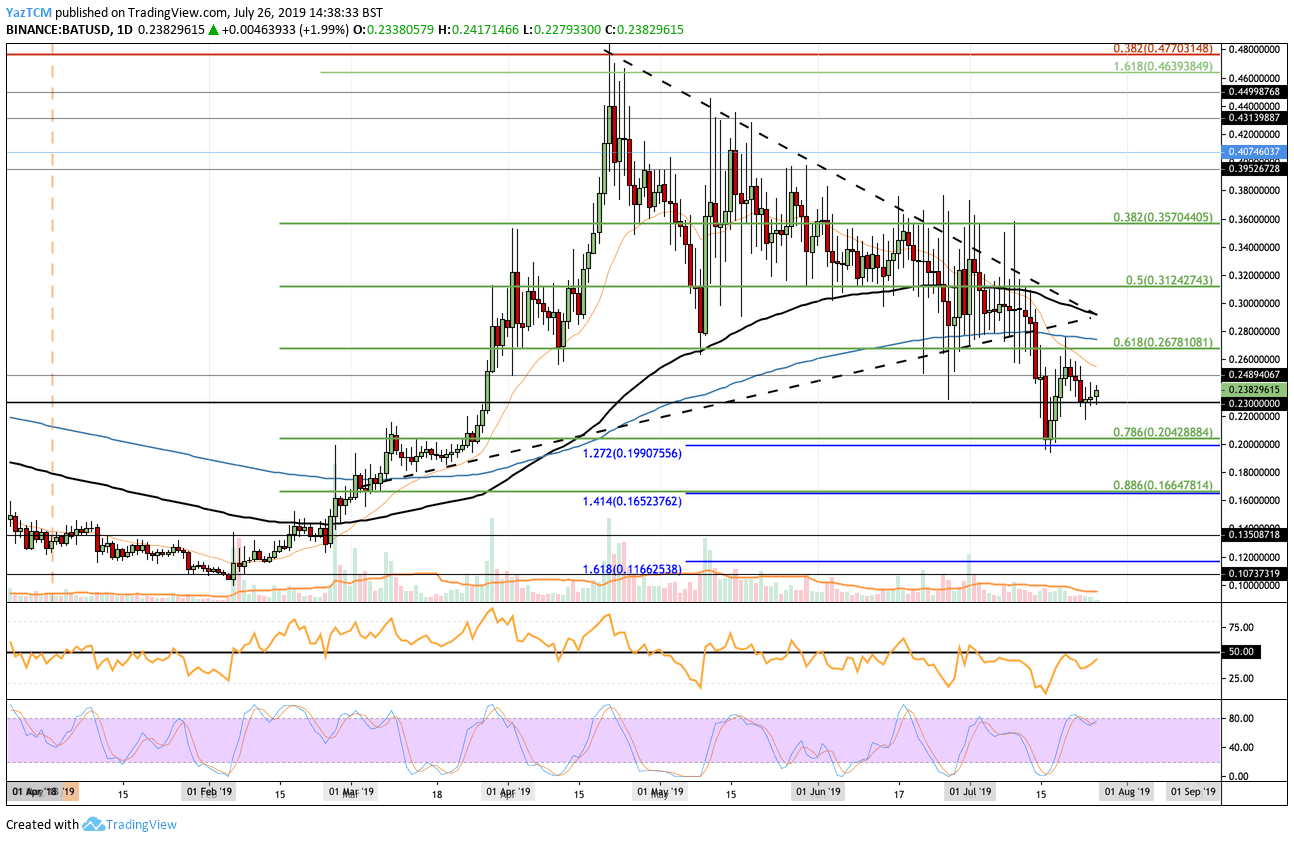
Looking at the BAT/USD 1-day chart:
- Trading against the US dollar, BAT has broken beneath the long-term symmetrical triangle as of this month, and consequently dropped beneath the 200-day EMA as well. BAT plunged through the triangle and continued to drop until finding support at the $0.204 level provided by the short-term 0.786 Fibonacci retracement. BAT rebounded at that support, and it’s now making its way back toward $0.25.
- From above: The nearest level of resistance lies at $0.25. Above this, higher resistance lies at $0.2678, $0.30, $0.3125, and $0.35.
- From below: The nearest level of support lies at $0.21. Beneath this, support is located at $0.2050, $0.20, and $0.19. Further support can be found at $0.166, provided by the 0.886 Fibonacci retracement level.
- The trading volume has decreased since April’s bull run and remains at an average level.
- The RSI is currently doing battle with the 50 level as the bulls attempt to gain control. However, the Stochastic RSI is close to overbought territory, with a crossover below suggesting a potential short-term drop.
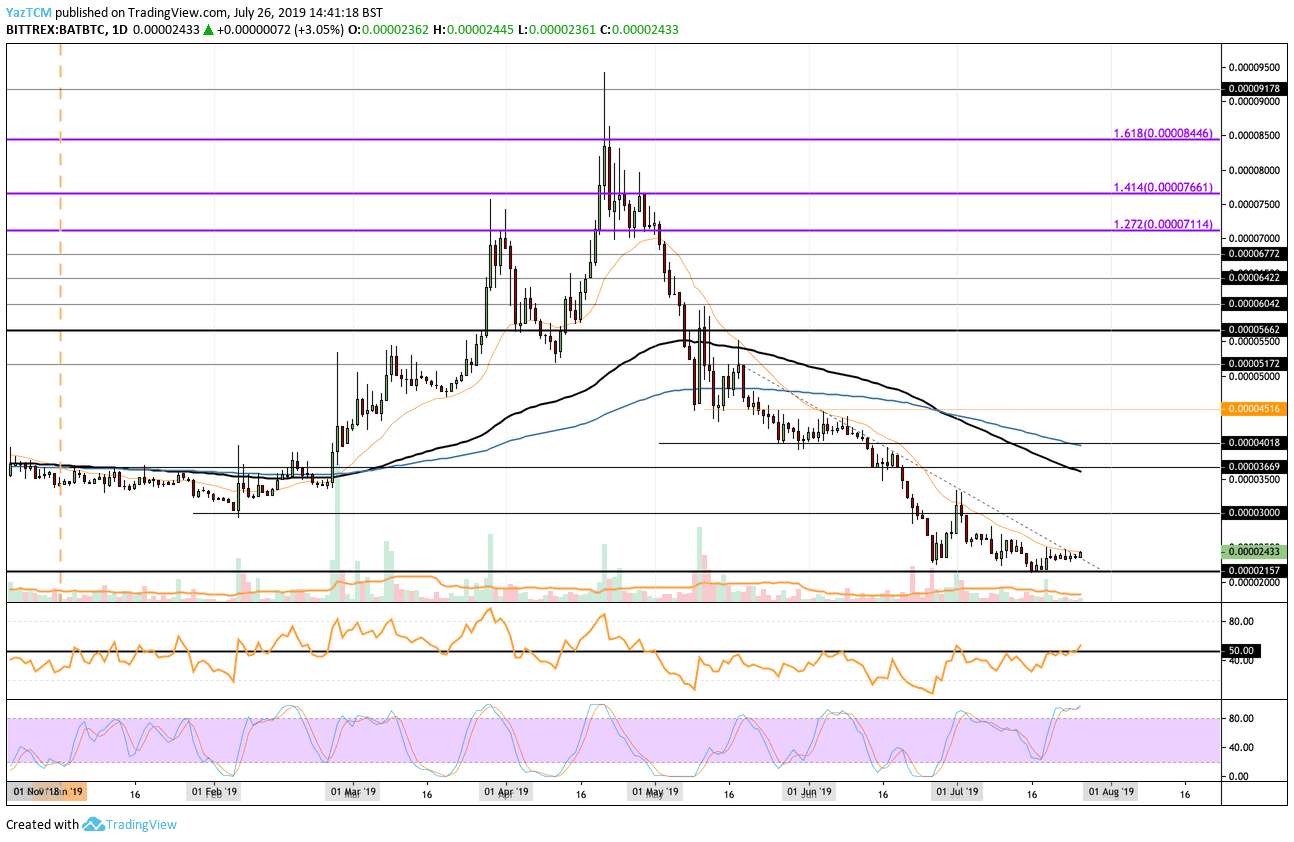
Looking at the BAT/BTC 1-day chart:
- Trading against Bitcoin, BAT has been tumbling since peaking around 8,500 satoshi in April. This market continued to drop until reaching support around 2,150 sat where it bounced. BAT is currently trading around 2,433 sat and recently attempted to break above a 3-month-old descending trend line.
- From above: The nearest level of strong resistance above 2,500 sat lies at 3,000 sat. Higher resistance is found at 3,500 sat (which contains the 100-day EMA) and 4,000 sat (contains the 200-day EMA). If the bulls continue above 4,000 sat, higher resistance lies at 4,500 sat and 5,000 sat.
- From below: The nearest level of support lies at 2,400 sat. Beneath this, lower support is expected at 2,150 sat and 2,000 sat. If the market does drop below 2,000 sat, more support is found at 1,830 sat, 1,560 sat and 1,200 sat.
- The trading volume remains lackluster and average.
- The RSI was recently successful in breaking above 50, which shows that the bulls have started to take control of the market. If it continues to rise higher, we can expect BAT to climb back toward 4,000 sat.
Be the first to know about our price analysis, crypto news and trading tips: Follow us on Telegram or subscribe to our weekly newsletter.
Source: cryptopotato.com
View original post