- Bitcoin cash is attempting a fresh increase from the $110 zone against the US Dollar.
- The price is now trading above the $115 zone and the 55 simple moving average (4-hours).
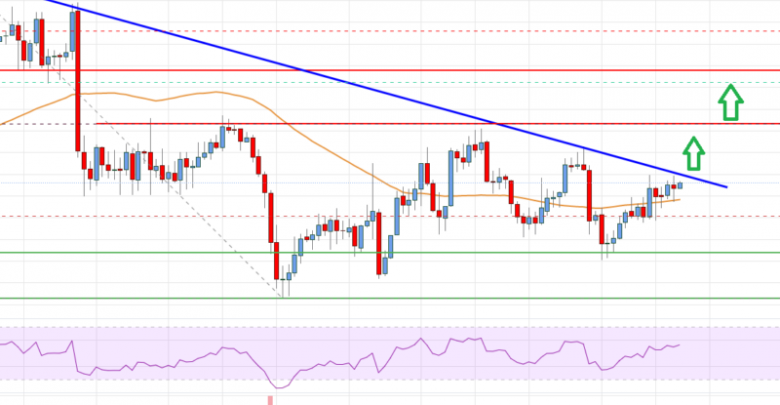
- There is a major bearish trend line forming with resistance near $118 on the 4-hours chart of the BCH/USD pair (data feed from Coinbase).
- The pair must clear $118 and $120 to continue higher in the near term.
Bitcoin cash price is climbing above $115 against the US Dollar, similar to bitcoin. BCH/USD could start a fresh surge if it clears the $120 level.
Bitcoin Cash Price Analysis
Bitcoin cash price formed a decent support base above the $110 level. BCH started a recovery wave and was able to clear the $112 resistance zone.
The price climbed above the $115 and $116 resistance levels. The pair surpassed the 23.6% Fib retracement level of the downward move from the $138 swing high to $106 low. It is now trading above the $115 zone and the 55 simple moving average (4-hours).
However, the price seems to be facing hurdles near the $118 and $120 levels. There is also a major bearish trend line forming with resistance near $118 on the 4-hours chart of the BCH/USD pair.
The next major resistance is near the $122 level. It is close to the 50% Fib retracement level of the downward move from the $138 swing high to $106 low, above which the price may perhaps rise towards the $130 level. Any more gains above $128 and $130 could set the pace for a move towards the $140 level.
Conversely, the price might trim gains and start a fresh decline below the $115 level and the 55 simple moving average (4-hours). An immediate support on the downside is near the $112 zone.
The next major support is near the $110 level, below which the bears might aim $105. The next target for them may perhaps be near the $100 level.

Bitcoin Cash Price
Looking at the chart, bitcoin cash price is now trading above the $115 zone and the 55 simple moving average (4-hours). Overall, the price must clear $118 and $120 to continue higher in the near term.
Technical indicators
4 hours MACD – The MACD for BCH/USD is gaining pace in the bullish zone.
4 hours RSI (Relative Strength Index) – The RSI for BCH/USD is above the 50 level.
Key Support Levels – $112 and $110.
Key Resistance Levels – $120 and $122.
Source: livebitcoinnews.com
View original post


