- Ripple price started a fresh decline from the $0.3600 resistance against the US dollar.
- The price is now trading below $0.350 and near the 55 simple moving average (4-hours).
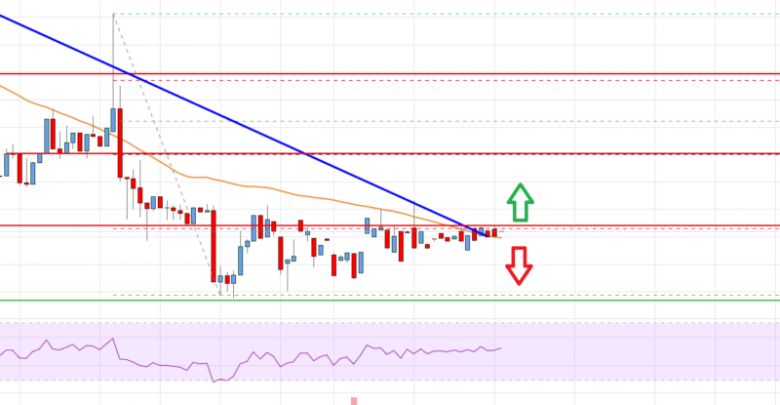
- There is a key bearish trend line forming with resistance near $0.3320 on the 4-hours chart of the XRP/USD pair (data source from Bittrex).
- The pair could start a steady increase if it clears the $0.3320 and $0.3450 resistance levels.
Ripple price is consolidating above $0.300 against the US Dollar, similar to bitcoin. XRP price must stay above $0.3000 to avoid more losses in the near term.
Ripple Price Analysis
This past week, ripple price saw a bearish reaction below the $0.3500 level against the US Dollar. The XRP/USD pair declined below the $0.3350 support zone to move into a bearish zone.
The price even traded below the $0.3200 level and the 55 simple moving average (4-hours). It traded as low as $0.3194 and is currently consolidating losses. On the upside, the price is facing resistance near $0.3320. It is near the 23.6% Fib retracement level of the recent decline from the $0.3705 swing high to $0.3194 low.
There is also a key bearish trend line forming with resistance near $0.3320 on the 4-hours chart of the XRP/USD pair. The next major resistance is near the $0.3450 level.
It is close to the 50% Fib retracement level of the recent decline from the $0.3705 swing high to $0.3194 low. A clear move above the $0.3450 and $0.3500 resistance zones might start a fresh increase. In the stated case, the price could even surpass the $0.350 resistance.
Any more gains might send the price towards the $0.382 resistance. An initial support on the downside is near the $0.3250 level. The next major support is near the $0.3195 level. Any more losses could lead the price towards the $0.3000 level, below which the price might even test $0.2750.

Ripple Price
Looking at the chart, ripple price is now trading below the $0.3500 zone and near the 55 simple moving average (4-hours). Overall, the price could start a steady increase if it clears the $0.3320 and $0.3450 resistance levels.
Technical indicators
4 hours MACD – The MACD for XRP/USD is now losing momentum in the bearish zone.
4 hours RSI (Relative Strength Index) – The RSI for XRP/USD is above the 50 level.
Key Support Levels – $0.3250, $0.3195 and $0.3000.
Key Resistance Levels – $0.3320 and $0.3450.
Source: livebitcoinnews.com
View original post


