- Bitcoin price started a fresh decline below the $20,000 zone against the US Dollar.
- The price is now trading above $19,600 and the 55 simple moving average (4-hours).
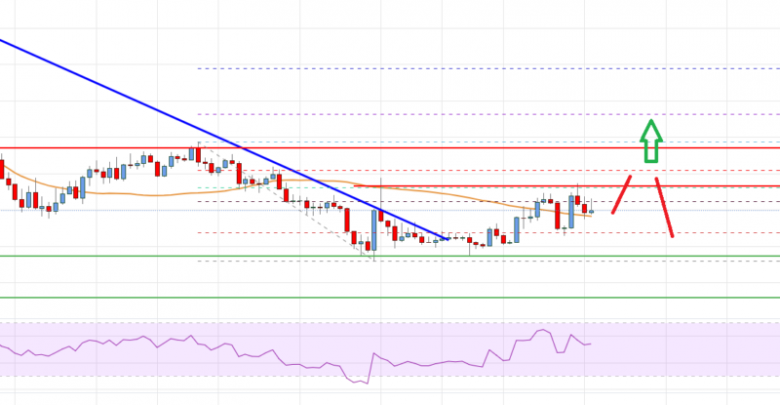
- There was a break above a major bearish trend line with resistance near $19,380 on the 4-hours chart of the BTC/USD pair (data feed from Coinbase).
- The pair could continue to rise if there is a clear move above the $21,000 resistance zone.
Bitcoin price is struggling below $21,000 against the US Dollar. BTC might extend losses if it stays below the $21,000 and $21,700 resistance levels.
Bitcoin Price Analysis
Bitcoin price started a major decline below the $22,000 support zone. There was a sharp bearish wave and the price even declined below the $20,000 support zone.
The bears pushed the price below the $19,200 level and the 55 simple moving average (4-hours). It even broke the $18,800 support. A low was formed near $18,603 and the price started an upside correction. There was a move above the $19,200 resistance zone.
The price cleared the 50% Fib retracement level of the recent decline from the $21,866 swing high to $18,603 low. Besides, there was a break above a major bearish trend line with resistance near $19,380 on the 4-hours chart of the BTC/USD pair.
However, the bears were active near the $20,650 zone. An immediate resistance on the upside is near the $20,250 level. The first major resistance is near the $20,600 level. It is near the 61.8% Fib retracement level of the recent decline from the $21,866 swing high to $18,603 low.
The next major resistance on the upside is near the $21,000 level, above which the price could rise towards the $22,000 zone. If there is no upside break, the price might start a fresh decline below $19,200. The next key support is near the $18,600 level. Any more losses might call for a move towards the $17,500 support zone.

Bitcoin Price
Looking at the chart, bitcoin price is clearly trading above $19,500 and the 55 simple moving average (4-hours). Overall, the price could continue to rise if there is a clear move above the $21,000 resistance zone.
Technical Indicators
4 hours MACD – The MACD is now gaining momentum in the bullish zone.
4 hours RSI (Relative Strength Index) – The RSI is now above the 50 level.
Key Support Levels – $19,200 and $18,600.
Key Resistance Levels – $20,600, $21,000 and $22,000.
Source: livebitcoinnews.com
View original post


