- Bitcoin cash price started a fresh decline from the $125 resistance against the US Dollar.
- The price is now trading below the $115 zone and the 55 simple moving average (4-hours).
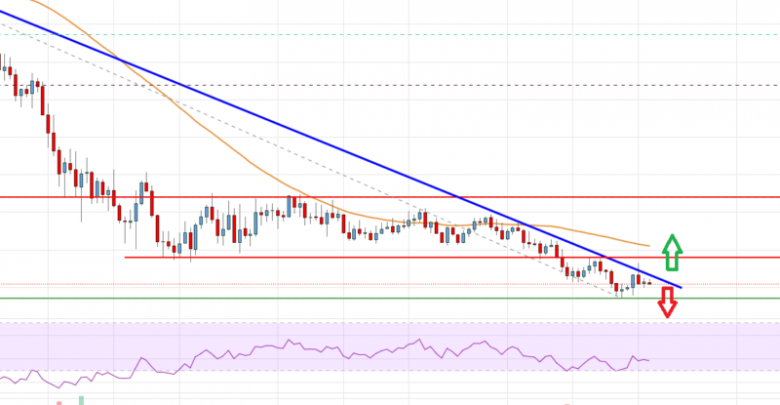
- There is a crucial bearish trend line forming with resistance near $102 on the 4-hours chart of the BCH/USD pair (data feed from Coinbase).
- The pair must clear $102 and $110 to start a fresh increase in the near term.
Bitcoin cash price is struggling below $120 against the US Dollar, similar to bitcoin. BCH/USD could start a fresh decline if it stays below $110.
Bitcoin Cash Price Analysis
Bitcoin cash price made a few attempts to gain strength above $125 and $130. However, BCH failed to gain pace and started a fresh decline below the $120 level.
There was a move below the $110 level and the 55 simple moving average (4-hours). The price even traded below the $105 support and formed a low near $97.02. It is now consolidating losses above the $100 level. An immediate resistance is near the $102 and $103 levels.
There is also a crucial bearish trend line forming with resistance near $102 on the 4-hours chart of the BCH/USD pair. The first major resistance is near the $110 level and the 55 simple moving average (4-hours).
On the upside, the next major resistance is near the $123 level. It is near the 23.6% Fib retracement level of the main drop from the $210 swing high to $97 low. Any more gains above $105 and $110 could set the pace for a move towards the $125 level.
If there is a move above the $125 resistance, the price could rise towards the $150 zone. It is near the 50% Fib retracement level of the main drop from the $210 swing high to $97 low.
An immediate support on the downside is near the $100 zone. The next major support is near the $97 level, below which the bears might gain strength. The next target for them may perhaps be near the $88 level.

Bitcoin Cash Price
Looking at the chart, bitcoin cash price is now trading below the $110 zone and the 55 simple moving average (4-hours). Overall, the price must clear $102 and $110 to start a fresh increase in the near term.
Technical indicators
4 hours MACD – The MACD for BCH/USD is slowly gaining pace in the bearish zone.
4 hours RSI (Relative Strength Index) – The RSI for BCH/USD is now near the 40 level.
Key Support Levels – $100 and $97.
Key Resistance Levels – $110 and $125.
Source: livebitcoinnews.com
View original post


