- Bitcoin cash price started a major increase above the $550 zone against the US Dollar.
- The price is now trading above the $600 zone and the 55 simple moving average (4-hours).
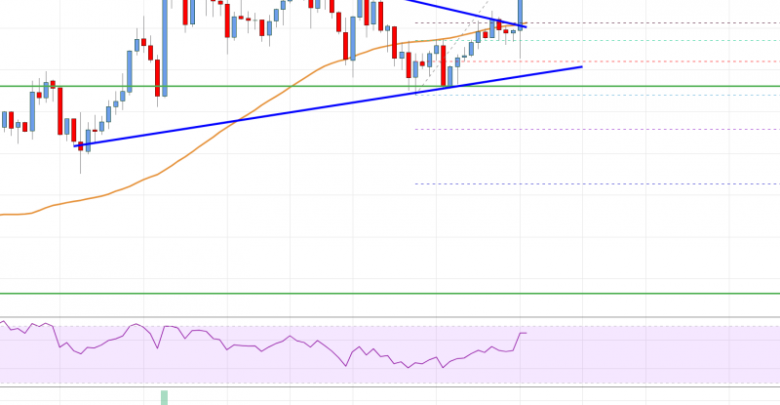
- There was a break above a major contracting triangle with resistance near $602 the 4-hours chart of the BCH/USD pair (data feed from Coinbase).
- The pair is consolidating gains and it could eye more upsides above $635 and $650.
Bitcoin cash price is showing positive signs above $600 against the US Dollar, similar to bitcoin. BCH/USD could resume its increase as long as it is above $570.
Bitcoin Cash Price Analysis
Bitcoin cash price started a major increase from the $520 zone. BCH broke the $580 resistance level and the 55 simple moving average (4-hours).
The price settled above the $600 level and surpassed the $600 level. There was also a break above a major contracting triangle with resistance near $602 the 4-hours chart of the BCH/USD pair. A high was formed near $637 and it is now consolidating gains.
It is trading near the $628 level. An initial support is near the $620 level. It is near the 23.6% Fib retracement level of the recent wave from the $567 swing low to $637 high.
The first major support is near the $600 level and the 55 simple moving average (4-hours). It is close to the 50% Fib retracement level of the recent wave from the $567 swing low to $637 high. The next major support is near the $570 level, below which the bears might aim a test of $500.
An immediate resistance is near the $635 level. The next major resistance could be $640. The main breakout zone is near the $650 level. A clear break above $635 and $650 might spark a fresh rally. In the stated case, the price could rise towards the $700 level.

Bitcoin Cash Price
Looking at the chart, bitcoin cash price is now trading above the $600 zone and the 55 simple moving average (4-hours). Overall, the price is consolidating gains and it could eye more upsides above $635 and $650.
Technical indicators
4 hours MACD – The MACD for BCH/USD is slowly gaining pace in the bullish zone.
4 hours RSI (Relative Strength Index) – The RSI for BCH/USD is now above the 50 level.
Key Support Levels – $600 and $570.
Key Resistance Levels – $635 and $650.
Source: livebitcoinnews.com
View original post


