- Ripple price started a strong decline from the $1.40 resistance against the US dollar.
- The price is now trading below $1.20 and the 55 simple moving average (4-hours).
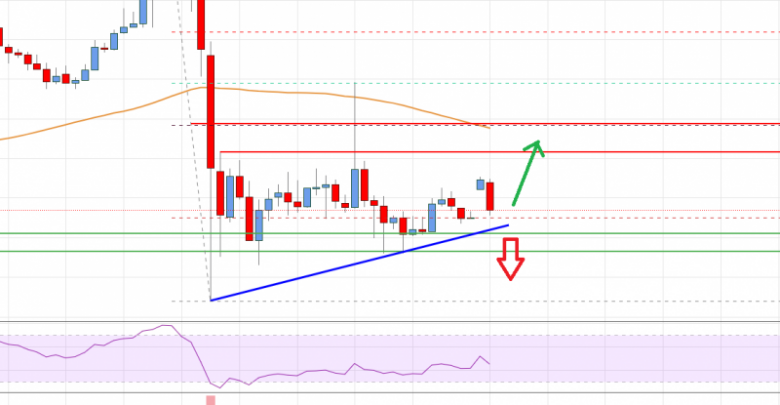
- There is a key bullish trend line forming with support near $1.05 on the 4-hours chart of the XRP/USD pair (data source from Bittrex).
- The pair could resume its decline as long as there is no close above the $1.20 resistance zone.
Ripple price is showing bearish signs below $1.20 against the US Dollar, similar to bitcoin. XRP price could decline heavily if there is a break below $1.05.
Ripple Price Analysis
After a major increase, ripple price faced resistance near the $1.40 zone against the US Dollar. The XRP/USD pair topped near $1.414 and started a major decline.
There was a break below the $1.30 and $1.25 support levels. It even broke the key $1.20 support and the 55 simple moving average (4-hours) to move into a bearish zone. Finally, there was a spike below the $1.00 level and the price traded as low $0.9700.
Recently, there was a recovery wave above the $1.05 resistance level. XRP corrected above the 23.6% Fib retracement level of the downward move from the $1.414 high to $0.9700 low.
However, the price seems to facing resistance near the $1.15 level. The first major resistance is near the $1.158 level. The main resistance is now forming near $1.20 and the 55 simple moving average (4-hours). It is close to the 50% Fib retracement level of the downward move from the $1.414 high to $0.9700 low.
A close above the $1.20 could set the pace for more gains. The next major resistance is near the $1.25 level. Any more gains could lead the price towards the $1.35 level.
On the downside, an initial support is near the $1.05 level. There is also a key bullish trend line forming with support near $1.05 on the 4-hours chart of the XRP/USD pair. Any more losses could lead the price towards the $0.9500 level.

Ripple Price
Looking at the chart, ripple price is now trading well below $1.20 and the 55 simple moving average (4-hours). Overall, the price could resume its decline as long as there is no close above the $1.20 resistance zone.
Technical indicators
4 hours MACD – The MACD for XRP/USD is now gaining momentum in the bearish zone.
4 hours RSI (Relative Strength Index) – The RSI for XRP/USD is now below the 50 level.
Key Support Levels – $1.05, $1.00 and $0.9500.
Key Resistance Levels – $1.15 and $1.20.
Source: livebitcoinnews.com
View original post


