- Bitcoin cash price started a fresh decline from well above $750 against the US Dollar.
- The price is now trading below the $700 zone and the 55 simple moving average (4-hours).
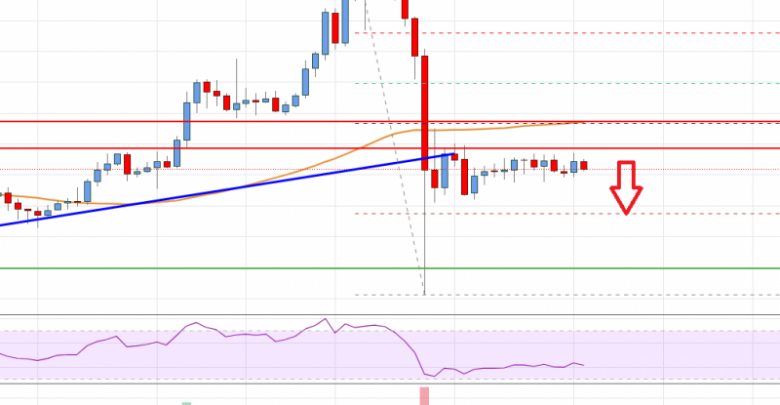
- There was a break below a major bullish trend line with support near $665 on the 4-hours chart of the BCH/USD pair (data feed from Coinbase).
- The pair could continue to decline unless it clears the $685 and $695 resistance levels.
Bitcoin cash price is struggling to recover above $700 against the US Dollar, similar to bitcoin. BCH/USD could extend its decline as long as it is below $700.
Bitcoin Cash Price Analysis
After forming a base above the $700 level, bitcoin cash price started a fresh increase. BCH broke many hurdles near the $750 level to move into a positive zone.
The price even broke the $780 resistance and the 55 simple moving average (4-hours). However, the price failed to gain pace above the $800 level. A high was formed near $804 and recently it started a fresh decline. There was a clear break below the $750 and $700 support levels.
There was a break below a major bullish trend line with support near $665 on the 4-hours chart of the BCH/USD pair. It even spiked below the $600 support level and traded as low as $582. The price is back above the $620 and $640 levels.
There was a break above the 23.6% Fib retracement level of the downward move from the $804 swing high to $582 low. It is now facing a strong resistance near the $680 zone. The next major resistance could be $695. The main breakout zone is near the $700 level. A clear break above $695 and $700 might trigger a sharp upward move.
On the downside, an initial support is near the $650 level. A downside break below the $650 support zone could open the doors for a fresh decline. The next major support is near the $620 level, below which the bears might aim a test of $600.

Bitcoin Cash Price
Looking at the chart, bitcoin cash price is now trading below the $700 zone and the 55 simple moving average (4-hours). Overall, the price could continue to decline unless it clears the $685 and $695 resistance levels.
Technical indicators
4 hours MACD – The MACD for BCH/USD is now gaining pace in the bearish zone.
4 hours RSI (Relative Strength Index) – The RSI for BCH/USD is below the 50 level.
Key Support Levels – $630 and $620.
Key Resistance Levels – $685 and $695.
Source: livebitcoinnews.com
View original post


