- Ripple price failed to settle above $1.30 and corrected lower against the US dollar.
- The price is now trading below $1.20 and the 55 simple moving average (4-hours).
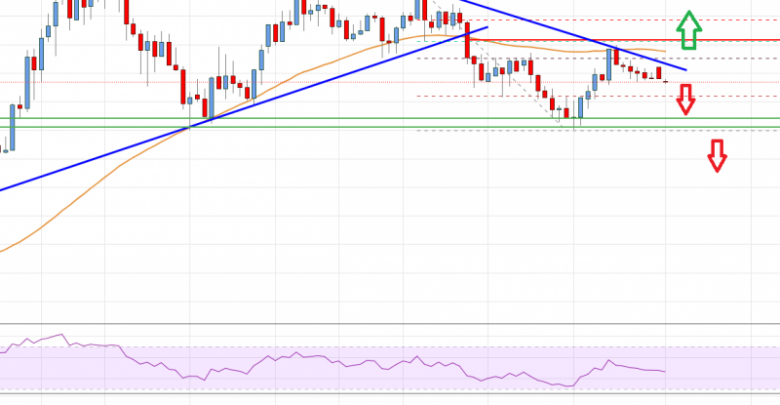
- There was a break below a major bullish trend line with support near $1.210 on the 4-hours chart of the XRP/USD pair (data source from Bittrex).
- The pair could continue to move down as long as it is below $1.200 and $1.205.
Ripple price is holding gains above the $1.00 support against the US Dollar, similar to bitcoin. XRP price must stay above $1.05 to avoid a major downside break.
Ripple Price Analysis
Recently, ripple price made an attempt to surpass the $1.30 resistance zone against the US Dollar. The XRP/USD pair failed to continue higher above the $1.30 resistance and started a fresh decline.
It broke the $1.25 and $1.22 support levels. There was also a break below a major bullish trend line with support near $1.210 on the 4-hours chart of the XRP/USD pair.
The pair even broke the $1.15 level and traded as low as $1.049. It is now trading below $1.20 and the 55 simple moving average (4-hours). Recently, there was an upside correction above the $1.15 level. The price surpassed the 50% Fib retracement level of the downward move from the $1.302 high to $1.049 low.
The price is now facing hurdles near $1.180 and the 55 simple moving average (4-hours). There is also a connecting bearish trend line with resistance near $1.18 level. The next major resistance is near the $1.20 level.
The 61.8% Fib retracement level of the downward move from the $1.302 high to $1.049 low is also near $1.205. To start a fresh rally, the price must clear the $1.205 resistance. In the stated case, the price could rise towards the $1.30 level.
On the downside, an initial support is near the $1.10 level. The next major support is near the $1.05 level. Any more losses could lead the price towards the 0.885 level.

Ripple Price
Looking at the chart, ripple price is now trading well below $1.20 and the 55 simple moving average (4-hours). Overall, the price could continue to move down as long as it is below $1.200 and $1.205.
Technical indicators
4 hours MACD – The MACD for XRP/USD is now losing momentum in the bearish zone.
4 hours RSI (Relative Strength Index) – The RSI for XRP/USD is now below the 50 level.
Key Support Levels – $1.10, $1.05 and $1.00.
Key Resistance Levels – $1.20 and $1.30.
Source: livebitcoinnews.com
View original post


