- Bitcoin cash price started a fresh decline from the $700 resistance against the US Dollar.
- The price is now trading below the $650 zone and the 55 simple moving average (4-hours).
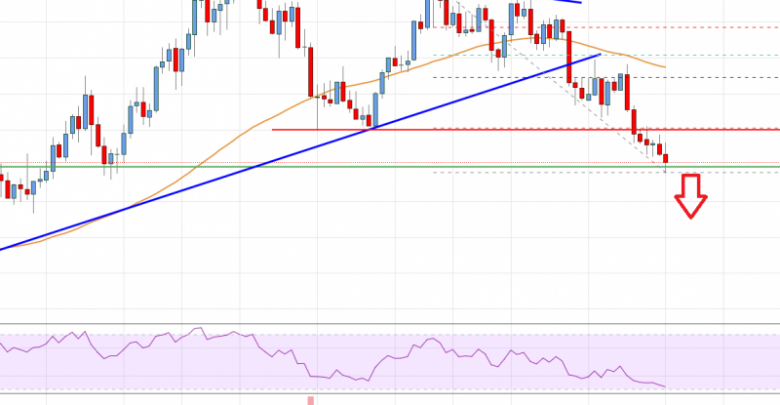
- There was a break below a key bullish trend line with support near $650 on the 4-hours chart of the BCH/USD pair (data feed from Coinbase).
- The pair is likely to accelerate lower if it breaks the $600 and $580 support levels.
Bitcoin cash price is moving lower below $625 against the US Dollar, similar to bitcoin. BCH/USD must stay above $600 to avoid more downsides in the near term.
Bitcoin Cash Price Analysis
After forming a base above the $620 level, bitcoin cash price started a fresh increase. BCH broke many hurdles near the $650 level to move into a positive zone.
The price even broke the $680 barrier and the 55 simple moving average (4-hours). However, the price failed to gain pace above the $700 level. A high was formed near $701 and recently it started a fresh decline. There was a clear break below the $680 and $660 support levels.
Besides, there was a break below a key bullish trend line with support near $650 on the 4-hours chart of the BCH/USD pair. The pair is now trading below the $650 zone and the 55 simple moving average (4-hours).
It is now trading near the $600 support zone. A downside break below the $600 support zone could open the doors for a larger decline. The next major support is near the $580 level, below which the bears might aim a test of $500.
An immediate resistance is near the $620 level. It is close to the 23.6% Fib retracement level of the downward move from the $702 swing high to $596 low.
The next major resistance could be $650 and the 55 simple moving average (4-hours). It is near the 50% Fib retracement level of the downward move from the $702 swing high to $596 low. A break above $650 might call for a move towards $700.

Bitcoin Cash Price
Looking at the chart, bitcoin cash price is now trading below the $620 zone and the 55 simple moving average (4-hours). Overall, the price is likely to accelerate lower if it breaks the $600 and $580 support levels.
Technical indicators
4 hours MACD – The MACD for BCH/USD is now gaining pace in the bearish zone.
4 hours RSI (Relative Strength Index) – The RSI for BCH/USD is below the 50 level.
Key Support Levels – $600 and $580.
Key Resistance Levels – $620 and $650.
Source: livebitcoinnews.com
View original post


