- Bitcoin cash price is struggling to clear the $550 resistance zone against the US Dollar.
- The price is now trading below $500 and the 55 simple moving average (4-hours).
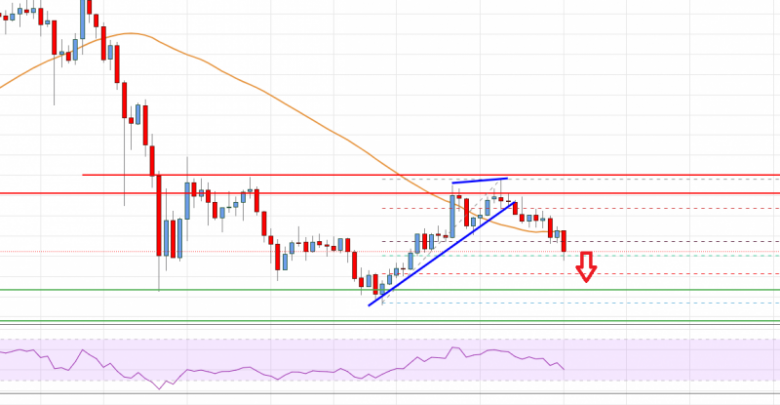
- There was a break below a key bullish trend line with support near $525 on the 4-hours chart of the BCH/USD pair (data feed from Coinbase).
- The pair could continue to move down towards the $450 and $415 support levels.
Bitcoin cash price is showing bearish signs below $500 against the US Dollar, similar to bitcoin. BCH/USD could retest $415 before it might start a decent upward move.
Bitcoin Cash Price Analysis
There was a slow recovery in bitcoin cash price above the $500 resistance zone. BCH price surpassed the $520 resistance and the 55 simple moving average (4-hours).
However, the price struggled to clear the $550 and $560 resistance levels. A high was formed near $556 before the price started a fresh decline. There was a break below the $500 support zone and the 55 simple moving average (4-hours).
There was also a break below a key bullish trend line with support near $525 on the 4-hours chart of the BCH/USD pair. The pair traded below the 50% Fib retracement level of the upward move from the $430 swing low $456 high.
It is now showing bearish signs below $500 and the 55 simple moving average (4-hours). An immediate support is near the $480 level. It is close to the 61.8% Fib retracement level of the upward move from the $430 swing low $456 high.
A clear break below the $480 support level could start a steady decline towards the $450 support. The next major support for the bulls might be $415.
On the upside, the price is facing many hurdles near the $500 and $520 levels. The main resistance is still near the $550 level. A clear break above the $550 and $560 levels is must for a steady upward move.

Bitcoin Cash Price
Looking at the chart, bitcoin cash price is clearly trading well $500 and the 55 simple moving average (4-hours). Overall, the price could continue to move down towards the $450 and $415 support levels in the near term.
Technical indicators
4 hours MACD – The MACD for BCH/USD is gaining pace in the bearish zone.
4 hours RSI (Relative Strength Index) – The RSI for BCH/USD is now well below the 50 level.
Key Support Levels – $450 and $415.
Key Resistance Levels – $500 and $550.
Source: livebitcoinnews.com
View original post


