- Bitcoin cash price started a fresh increase above the $450 resistance against the US Dollar.
- The price climbed above the $485 resistance and the 55 simple moving average (4-hours).
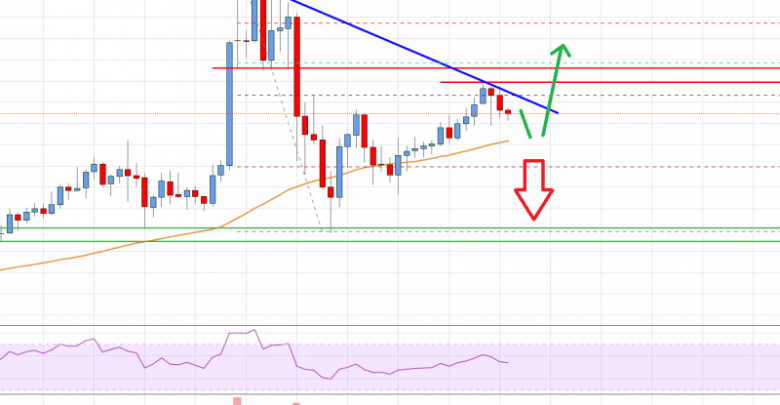
- There is a major bearish trend line forming with resistance near $520 on the 4-hours chart of the BCH/USD pair (data feed from Coinbase).
- The pair could either rally further above $520 or it might dip sharply below the $485 support.
Bitcoin cash price is showing positive signs above $485 against the US Dollar, similar to bitcoin. BCH/USD is likely to accelerate higher once it clears the $520 resistance.
Bitcoin Cash Price Analysis
After forming a support base near the $400 level, bitcoin cash price started a strong increase. BCH price broke many hurdles near $450 and $455 to move into a positive zone.
The upward move gained pace above the $485 level and the 55 simple moving average (4-hours). The price even cleared the 23.6% Fib retracement level of the key decline from the $4654 high to $398 low. There was a spike above the $500 level, but the price seems to be facing hurdles near $535.
There is also a major bearish trend line forming with resistance near $520 on the 4-hours chart of the BCH/USD pair. The trend line is close to the 50% Fib retracement level of the key decline from the $4654 high to $398 low.
A clear break above the trend line resistance and then $535 could open the doors for a larger increase. In the stated case, the price could surge towards the $550 and $565 levels. Any more losses might call for a test of the $600 level.
On the downside, the price is likely to remain stable above $485 and the 55 simple moving average (4-hours). A downside break below the $485 support may possibly lead the price towards the $450 level. The main support is still near the $400 level.

Bitcoin Cash Price
Looking at the chart, bitcoin cash price is clearly holding gains above $485 and the 55 SMA (H4). Overall, the price could either rally further above $520 or it might dip sharply below the $485 support.
Technical indicators
4 hours MACD – The MACD for BCH/USD is slowly losing pace in the bullish zone.
4 hours RSI (Relative Strength Index) – The RSI for BCH/USD is currently above the 50 level.
Key Support Levels – $485 and $450.
Key Resistance Levels – $520 and $550.
Source: livebitcoinnews.com
View original post


