- Ripple price declined heavily and recently started consolidating above $0.200 against the US dollar.
- The price is now facing hurdles near $0.2500 and the 55 simple moving average (4-hours).
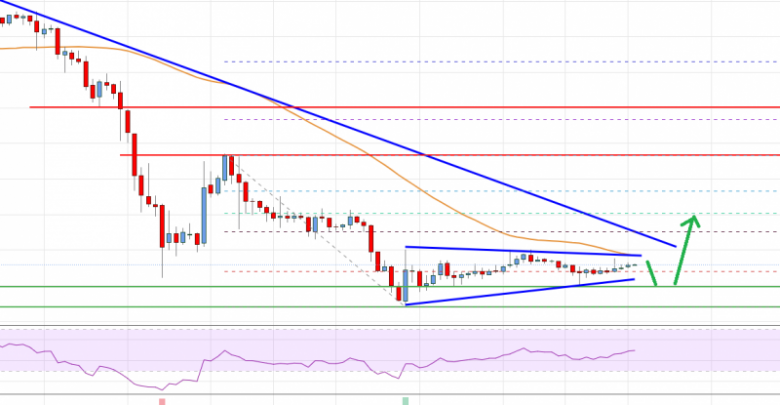
- There is a major contracting triangle forming with resistance near $0.2500 on the 4-hours chart of the XRP/USD pair (data source from Bittrex).
- The pair could start a strong increase if it clears the $0.2500 and $0.2650 resistance levels.
Ripple price is showing bullish signs above $0.2200 against the US Dollar. XRP price must clear $0.2500 to start a decent upward move in the coming sessions.
Ripple Price Analysis
This past week, there was a strong decline in ripple price from well above $0.2800 against the US Dollar. The XRP/USD pair broke many important supports near $0.2500 to move further into a bearish zone.
The price even declined below $0.2200 and settled well below the 55 simple moving average (4-hours). It traded as low as $0.1695 before starting a downside correction. The price managed to recover above the $0.1800 and $0.2000 resistance levels.
The upward move was such that there was a break above the 23.6% Fib retracement level of the downward move from the $0.3822 swing high to $0.1695 low. It is now consolidating losses above the $0.2000 and $0.2100 levels.
It seems like there is a major contracting triangle forming with resistance near $0.2500 on the 4-hours chart of the XRP/USD pair. The triangle resistance at $0.2500 is close to the 55 simple moving average (4-hours). The next major resistance is near the $0.2650 level.
There is also a key bearish trend line forming with resistance near $0.2650 on the same chart. The next hurdle could be the 50% Fib retracement level of the downward move from the $0.3822 swing high to $0.1695 low.
A clear break above the $0.2500 and $0.2650 resistance levels may possibly increase the chances of a drift towards the $0.3000 level in the coming sessions. If not, there is a risk of more downsides below the $0.2200 and $0.2120 levels. The next major support could be near the $0.1800 level.

Ripple Price
Looking at the chart, ripple price is clearly trading in a negative zone below $0.2500 and the 55 SMA (H4). Overall, the price could start a strong increase if it clears the $0.2500 and $0.2650 resistance levels.
Technical indicators
4 hours MACD – The MACD for XRP/USD is currently showing no major breakout sign in the bearish zone.
4 hours RSI (Relative Strength Index) – The RSI for XRP/USD is rising towards the 60 level.
Key Support Levels – $0.2200, $0.2100 and $0.2000.
Key Resistance Levels – $0.2500 and $0.2650.
Source: livebitcoinnews.com
View original post


