Ripple Price Analysis: Upsides Likely To Be Limited Above $0.35
- Ripple price struggled to recover above $0.3800 and started a fresh decline against the US dollar.
- The price is now trading below the $0.3000 support zone and the 55 simple moving average (4-hours).
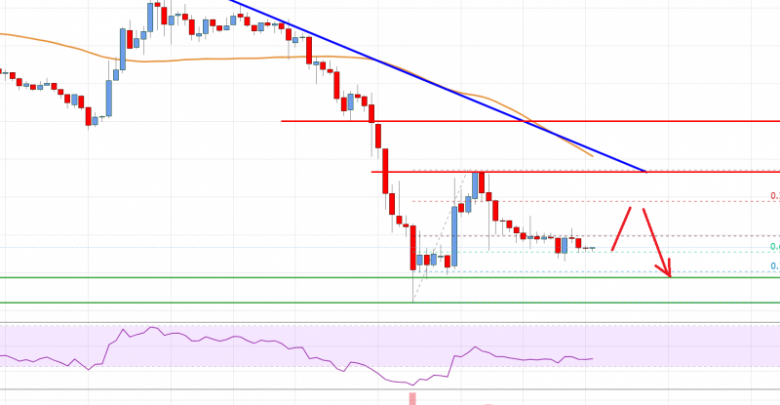
- There is a major bearish trend line forming with resistance near $0.3850 on the 4-hours chart of the XRP/USD pair (data source from Bittrex).
- The pair could continue to move down below $0.2800 and $0.2650 in the near term.
Ripple price is showing bearish signs below $0.3000 against the US Dollar. XRP price remains at a risk of more downsides below $0.2800 unless it settles above $0.3800.
Ripple Price Analysis
This past week, there was a strong decline in ripple price from well above $0.4000 against the US Dollar. The XRP/USD pair broke many important supports near $0.3000 to move further into a bearish zone.
The price even declined below $0.2500 and settled well below the 55 simple moving average (4-hours). It traded as low as $0.2107 before starting a downside correction. The price gained pace above $0.2500 and it even recovered above the $0.3000 level.
However, the price faced a strong selling interest near the $0.3800 level. There is also a major bearish trend line forming with resistance near $0.3850 on the 4-hours chart of the XRP/USD pair. A high was formed near $0.3864 before the price started a fresh decline.
It broke the $0.3000 support and now trading well below the 55 simple moving average (4-hours). There was also a break below the 50% Fib retracement level of the upward move from the $0.2107 low to $0.3864 high.
The price is now trading near the $0.2800 support. The first major support on the downside is near the $0.2500 level. It is close to the 76.4% Fib retracement level of the upward move from the $0.2107 low to $0.3864 high. If there is a clear break below $0.2500, the price could decline towards $0.2000.
On the upside, there are many hurdles, starting with $0.3000. The first major resistance is near $0.3440. The main resistance is still near $0.3800. A clear break above the $0.3800 and $0.3880 resistance levels might open the doors for a fresh surge.

Ripple Price
Looking at the chart, ripple price is clearly trading in a bearish zone below $0.3000 and the 55 SMA (H4). Overall, the price could continue to move down below $0.2800 and $0.2650 in the near term.
Technical indicators
4 hours MACD – The MACD for XRP/USD is currently gaining momentum in the bearish zone.
4 hours RSI (Relative Strength Index) – The RSI for XRP/USD is now 5 below the 50 level.
Key Support Levels – $0.2500, $0.2100 and $0.2000.
Key Resistance Levels – $0.3440 and $0.3800.
Source: livebitcoinnews.com
View original post


