The market crash of the 12th–13th of March, was an unexpected and tough trial even for seasoned investors. The actual reasons behind the crash are still up for debate.
In terms of economic theory, the price was falling because the supply clearly exceeded the demand. It is also clear that the mass sales had to do with the declaration of a pandemic by the WHO.
Still, these explanations are superficial. They do not show who were the most active sellers, how large were their investments, and were they new to the field or had some experience under their belts.
Armed with reports by CoinMetrics and Chainalysis, as well as with Glassnodes’ analytics tools, ForkLog figures out what actually caused the crash in the crypto-markets.
Short-Term Investors Dominated the Crash
CoinMetrics’ researchers concluded that the key role in the recent market crash was played by short-term investors. It’s been suggested that many of them have just recently entered the digital asset market.
On March 11th, 281,000 BTC came into motion after being dormant for at least 30 days. Only 4,131 BTC of those haven’t moved for over a year. The market activity on March 11th and 12th mostly involved the coins held for less than a year.
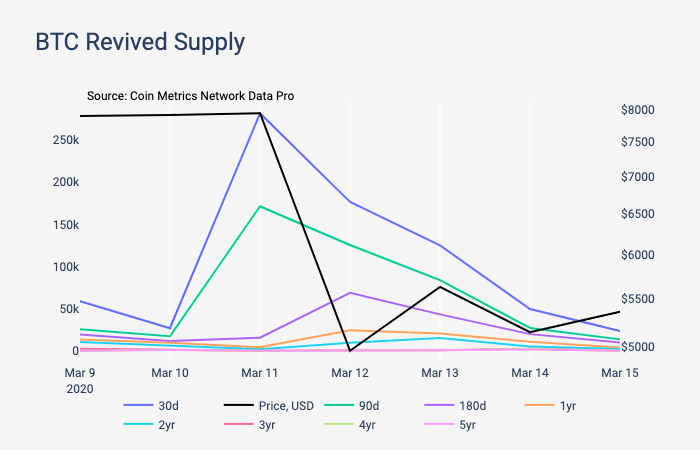
Movement of coins of different “age” amidst the recent Bitcoin crash. Source: Coinmetrics
March 11th brought the surge of activity for coins held for less than 30 days. It was the fourth-largest of such surges for the last 8 years.
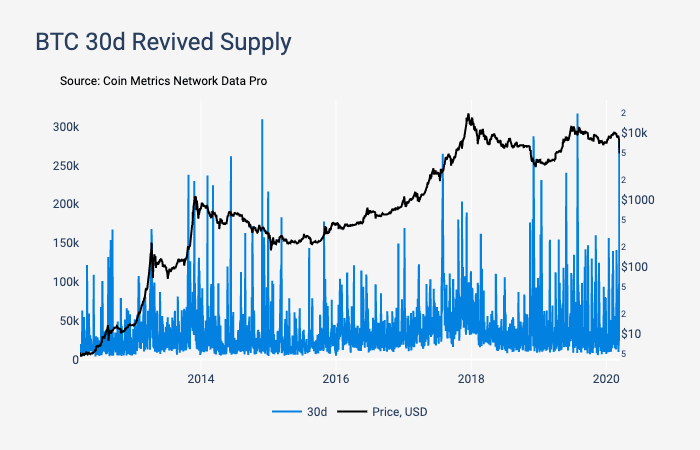
Charts of the Bitcoin price and the supply of BTC held for less than 30 days. Source: Coinmetrics
Long-term investors weren’t nearly as active during the same period.
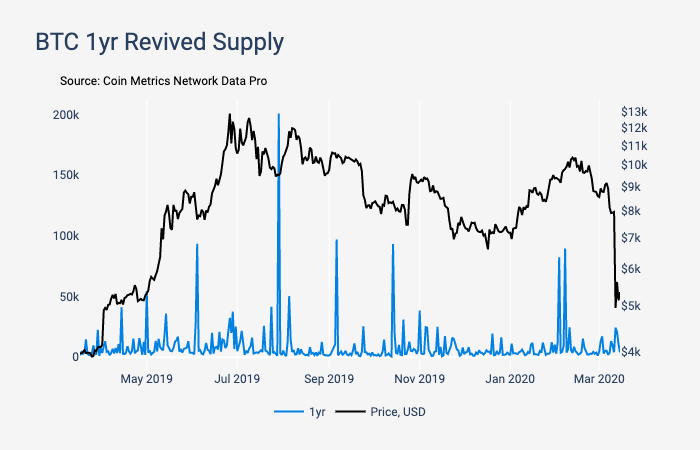
Charts of the Bitcoin price and the supply of BTC held for over a year. Source: Coinmetrics
On March 12th, the BTC SOPR indicator, which represents the ratio between the price sold and the price paid when new transaction outputs and inputs are created, dropped to 0.843 for the first time since February 2020. The ratio of less than 1 indicates that traders are selling at a loss.
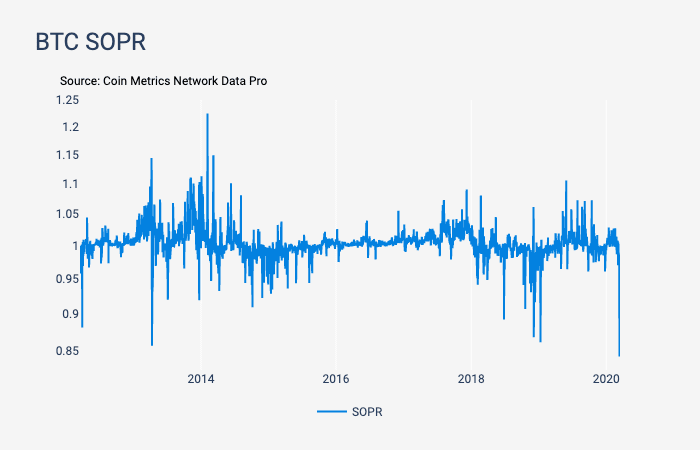
BTC SOPR indicator chart. Source: CoinMetrics
Additionally, MVRV, the indicator that shows the ratio between Bitcoin market value and realized value, went below 1.
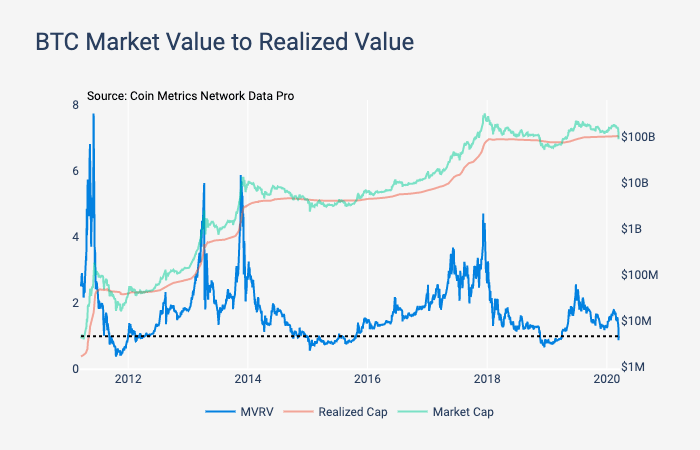
BTC market value to realized value chart. Source: Coinmetrics
MVRV values greater than 1 indicate that speculators are more interested in coins than long-term investors and vice versa. The current values show that hodlers are unlikely to sell the coins at the current price.
Crash for Some, Market Cap Growth for Others
CoinMetrics’ researchers also noticed that most stablecoins’ market capitalization was growing during the crash of the wider market.
“This potentially signals that investors are piling into ‘cash,’ or at least crypto-cash equivalents,” reads the CoinMetrics’ report.
They also noted that the market capitalization of Tether, an Ethereum-based stablecoin, gained around $300 million between March 10th and March 15th. Meanwhile, USDC gained $150 million over the same period.
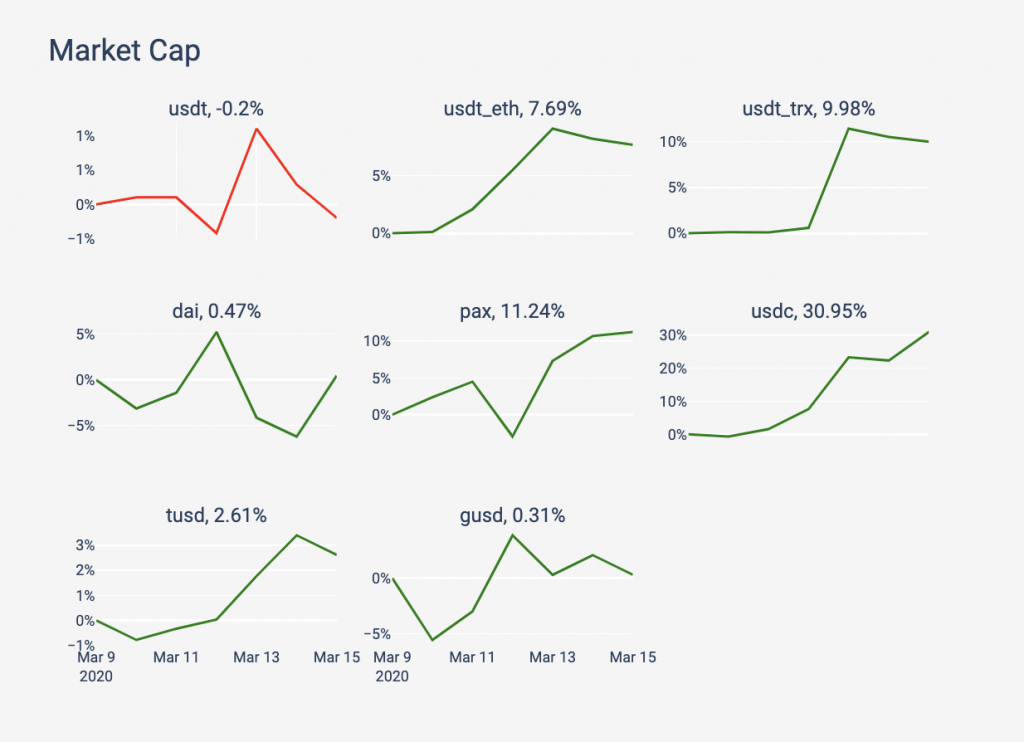
Market cap dynamics of popular stablecoins between March 10th and March 15th. Source: Coinmetrics
Exchanges Receiving Lots of BTC
Another thing pointed out by CoinMetrics is that on March 13th, over 160,000 BTC were transferred to popular centralized exchanges, including Binance, Bitfinex, BitMEX, Bitstamp, Bittrex, Gemini, Huobi, Kraken, and Poloniex. It was the largest single-day inflow volume since 2017.
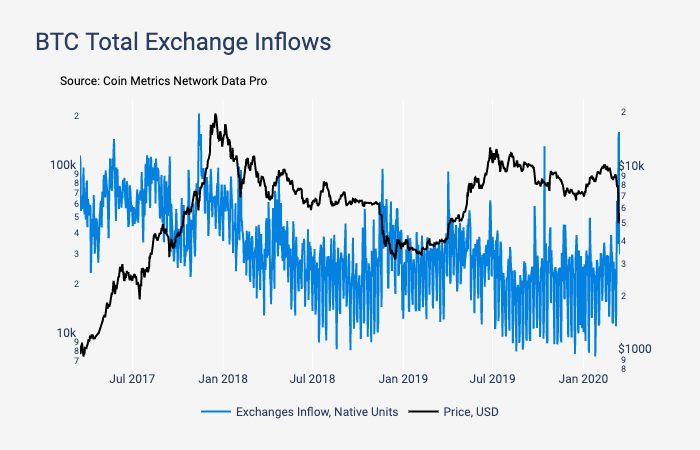
Exchanges’ BTC inflow dynamics and BTC price charts. Source: Coinmetrics
Over 171,000 BTC followed the same scenario on March 13th.
BitMEX received most of the coins: 42,200 BTC on March 12th and 37,500 BTC on March 13th.
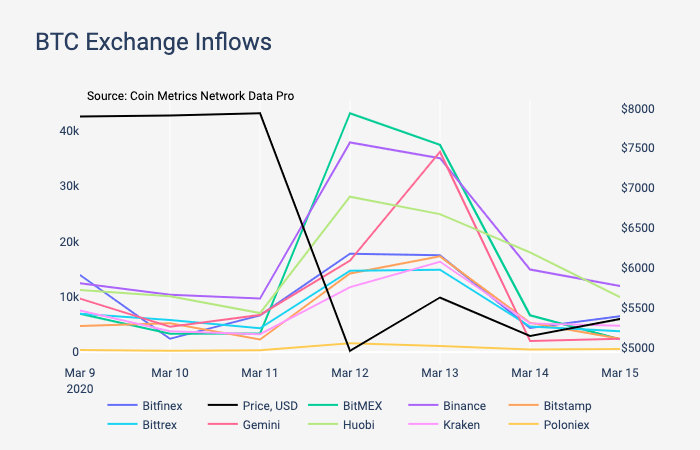
BTC inflow dynamics for different exchanges. Source: Coinmetrics
Notably, more money was flowing out of Binance and Huobi, than out of BitMEX.
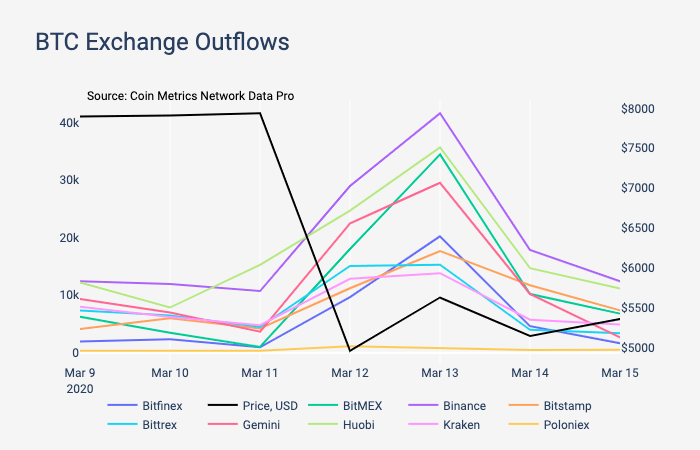
BTC outflow dynamics for different exchanges. Source: Coinmetrics
As a result, BitMEX was controlling its largest supply volume amounting to 315,700 BTC by March 13th.
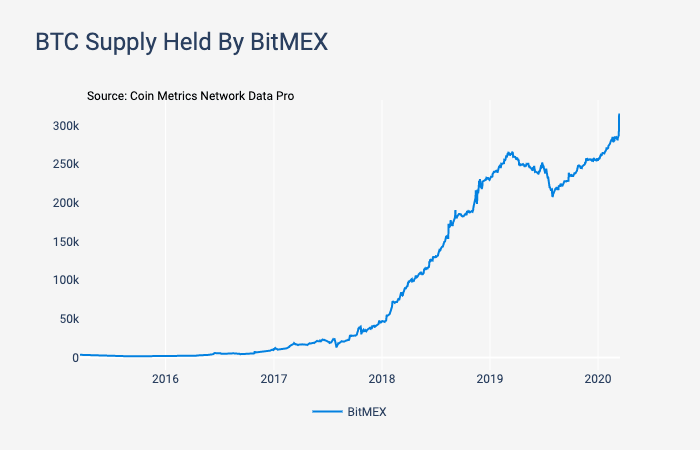
BitMEX’s BTC Supply Dynamics. Source: CoinMetrics
Moreover, during the mass sale, the price spread between BitMex and Coinbase reached 16%.
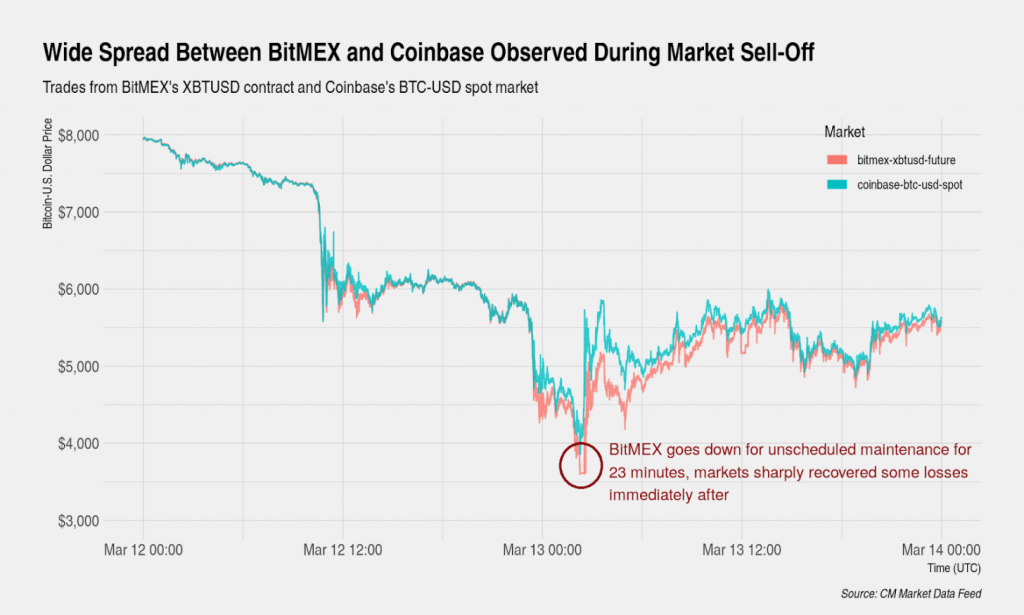
Spread between Conbase’s BTC/USD spot market price and BitMEX’s XBTUSD contract price. Source: CoinMetrics
“This is likely because forced liquidations from leveraged perpetual swap futures tend to exaggerate the direction of any move. The market recovered after BitMEX went down for 23 minutes reportedly due to unscheduled maintenance,” the researchers noted.
Chainalysis experts got similar results. According to them, over eight days starting on Mach 9th, 1.1 million BTC were transferred to crypto-exchanges. The largest daily inflow volume of 319,000 BTC was observed on March 13th. For comparison, the average daily inflow between the beginning of 2020 and March 9th was 52,000 BTC.
“9x the daily average amount of bitcoin was sent to exchanges to be sold from March 12 to March 13. This selling pressure led to a ~37% fall in price,” reads Chainalysis’s blog post.
The experts concluded that the mass sale was carried out predominantly by retail players, as the inflow of deposits of 0.1–10 BTC doubled between March 9th and 17th.
Yet, according to Chainalysis, big-time holders were also substantially active, since 70% of transactions to and from exchanges were somewhere between 10 and 1,000 BTC. About 10% of transactions were north of 1,000 BTC. Although, only 5% of the available BTC were sold during that period.
Buy When There’s Blood in the Streets
According to the data by payment processor Simplex, retail investors were, in fact, actively buying during the crash.
Bitcoin was the most popular asset with 59,6% of the total volume for the period between March 12th and 14th. Following the first crypto were Tether with a 12.6% share and Ether with 9.78%.
“The market downturn hasn’t dampened the public’s enthusiasm for purchasing crypto. In fact, it’s clear that many people have seen the recent dip as a buying opportunity rather than a sign that crypto’s investment thesis has been invalidated,” Simplex CEO Nimrod Lehavi said in a statement shared with The Block.
The data by Glassnode supports the point about long-term investors being unaffected even by the harshest drops.
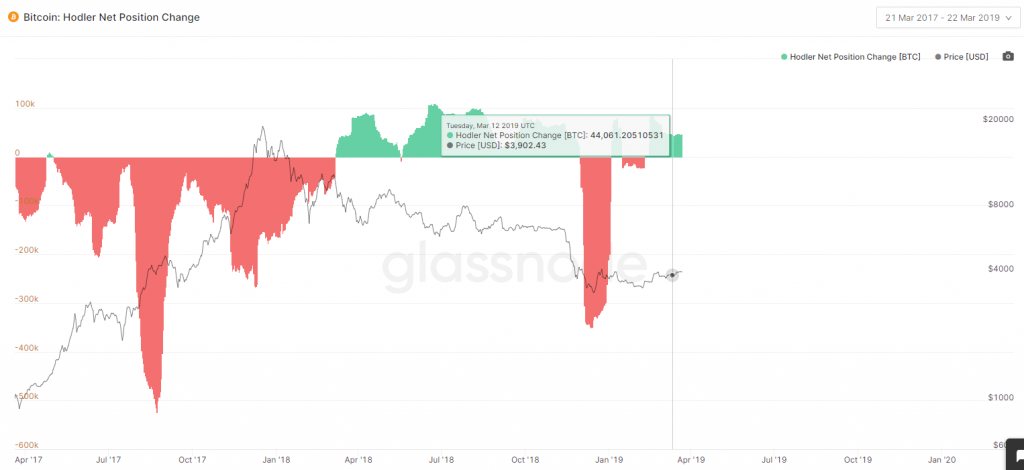
Bitcoin net position change chart. Source Glassnode
Given that between March 12th and 13th the chart was in the green, whales were buying.
“We can see that this February, when prices approached $10k, hodlers stopped accumulating more BTC, potentially having identified it as a market top. However, during the crash last week, hodlers began accumulating, signaling confidence in BTC at this price point,” reads Glassnode’s blog post.
The experts also noted that the levels reached during the crash will form the support level for long-term investors.
Conclusion
Considering the high activity of “young” addresses with a small balance and low values of BTC SOPR, it seems that inexperienced short-term investors are more prone to panic sales than long-term hodlers.
During the recent crash, large Bitcoin hodlers were acting in a much more restrained manner than retail investors. Moreover, whales were ahead of everyone else in accumulating positions and “buying the dip.” This may prove hodlers’ long-term commitment and confidence in the future of Bitcoin.
This is an adaptation of the original Russian-language article written by Alexander Kondratiuk.
Follow us on Twitter and Facebook and join our Telegram channel to know what’s up with crypto and why it’s important.
Source: forklog.media
View original post