Ethereum Price Analysis: ETH Overcome Hurdles, More Upsides Possible
- Ethereum price is gaining bullish momentum above the $145 resistance against the US Dollar.
- ETH price could continue to rise and it might break the $152 and $155 resistance levels.
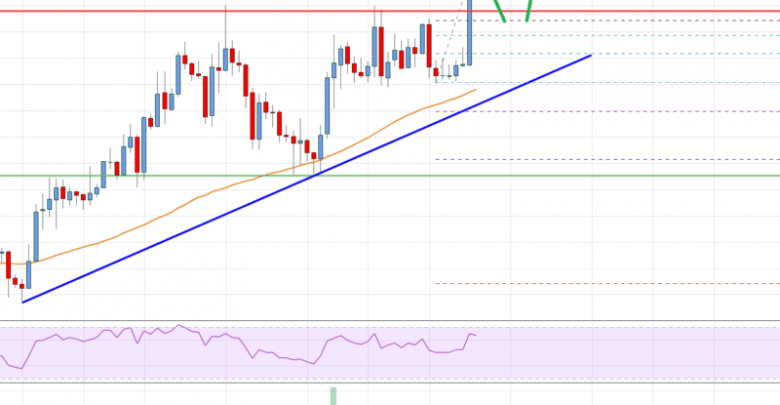
- There is a key bullish trend line forming with support near $143 on the 4-hours chart (data feed from Coinbase).
- The price could correct lower, but buyers are likely to protect $145 and $143.
Ethereum price is showing a lot of bullish signs against the US Dollar. ETH/USD could continue to rise if it clears the $152 resistance area in the near term.
Ethereum Price Analysis
After forming a support above the $135 level, Ethereum price started a strong upward move against the US Dollar. ETH price broke a few key hurdles near the $140 level to move into a bullish zone.
Moreover, the price settled above the $140 level and the 55 simple moving average (4-hours). Finally, the price surged above the $145 resistance and it recently spiked above the $150 level.
A new 2020 high is formed near $152 and the price is currently correcting gains. Ethereum is trading below the 23.6% Fib retracement level of the upward wave from the $142 low to $152 high.
The first key support is near the $148 level, which acted as a major resistance for the bulls in the past few sessions. If there are any further losses, the price could test the $145 support area.
An intermediate support is near the 50% Fib retracement level of the upward wave from the $142 low to $152 high. Besides, there is a key bullish trend line forming with support near $143 on the 4-hours chart.
Therefore, dips in Ethereum remains well supported near the $148 and $145 levels. The 55 simple moving average (4-hours) is also likely to act as a support near the $142 level.
On the upside, an initial resistance is near the $152 level. A clear break above the $152 zone could start another increase. In the mentioned bullish case, the price is likely to surge above the $155 and $158 levels in the near term.

Ethereum Price
Looking at the chart, Ethereum price is showing a lot of bullish signs above the $145 level. In the short term, there could be a downside correction, but the price remains well supported for more gains above $152 and $155.
Technical indicators
4 hours MACD – The MACD for ETH/USD is currently losing momentum in the bullish zone.
4 hours RSI (Relative Strength Index) – The RSI for ETH/USD is still well above the 60 level.
Key Support Levels – $148, followed by the $145 zone.
Key Resistance Levels – $152 and $155.
Source: livebitcoinnews.com
View original post


