Stellar Lumen (XLM) Price Facing Significant Hurdles Near $0.050
- Stellar lumen price started an upside correction from the $0.0420 support area against the US Dollar.
- XLM price is currently trading above $0.0450, but there are many hurdles near $0.0500.
- There is a significant bearish trend line forming with resistance near $0.0500 on the 4-hours chart (data feed via Kraken).
- The pair could restart its decline if it fails to stay above the $0.0450 support area.
Stellar lumen price is slowly correcting higher against the US Dollar, while bitcoin is rallying. XLM price must surpass the $0.0500 hurdle to continue higher.
Stellar Lumen Price Analysis (XLM to USD)
This past week, stellar lumen price tested the $0.0420 support area against the US Dollar. The XLM/USD pair traded as low as $0.0421 and later started an upside correction.
There was a break above the $0.0440 and $0.0450 resistance levels. The price recovered above the 23.6% Fibonacci retracement level of the downward move from the $0.0529 high to $0.0421 low.
Moreover, there was a close above $0.0450 and the 55 simple moving average (4-hours). However, the price is now facing resistance near the $0.0475 level.
Besides, the 50% Fibonacci retracement level of the downward move from the $0.0529 high to $0.0421 low is also acting as a resistance. The main resistance on the upside is near the $0.0500 level.
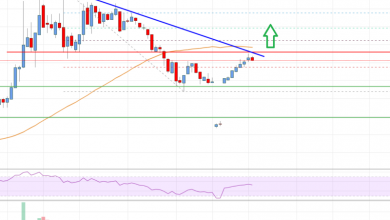
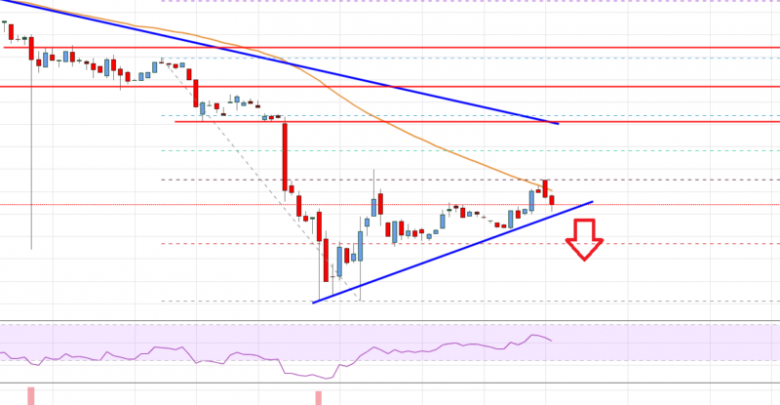
More importantly, there is a significant bearish trend line forming with resistance near $0.0500 on the 4-hours chart. Additionally, the 76.4% Fibonacci retracement level of the downward move from the $0.0529 high to $0.0421 low is near the $0.0504 level.
Therefore, an upside break above the $0.0500 and $0.0505 levels is needed to push stellar price into a positive zone. Conversely, the price could start a fresh decline below the $0.0460 ad $0.0450 support levels.
If the price breaks the $0.0450 support, the bears are likely to gain strength. In the mentioned case, there is a risk of more losses below the $0.0421 swing low in the near term. The next major support is seen near the $0.0400 level.

Stellar Lumen Price
The chart indicates that XLM price is showing positive signs above the $0.0460 and $0.0450 support levels. However, there are many hurdles near the $0.0500 and $0.0505 levels, above which the trend might change to bullish in the medium term.
Technical Indicators
4 hours MACD – The MACD for XLM/USD is currently losing momentum in the bullish zone.
4 hours RSI – The RSI for XLM/USD is declining and it is approaching the 50 level.
Key Support Levels – $0.0450 and $0.0421.
Key Resistance Levels – $0.0475, $0.0500 and $0.0505.
Source: investing.com
View original post