
Ethereum Price Analysis: ETH Creates Fresh December Low At $140, More Pain Coming?
- Ethereum dropped back beneath the $150 level to create a fresh low for December at $140.
- The cryptocurrency trades strong against BTC as it remains above 0.02 BTC.
- It has dropped by a steep 22% this month as the bears keep their strong grip on momentum.
Key Support & Resistance Levels
ETH/USD
Support: $145, $138.80, $133.50
Resistance: $152, $158.60, $165, $170.
ETH/BTC:
Support: 0.0196 BTC, 0.019 BTC, 0.0184 BTC
Resistance: 0.020 BTC, 0.021 BTC, 0.0215 BTC, 0.0223 BTC
ETH/USD: ETH Creates Fresh Dec Lows – More Pain Incoming?
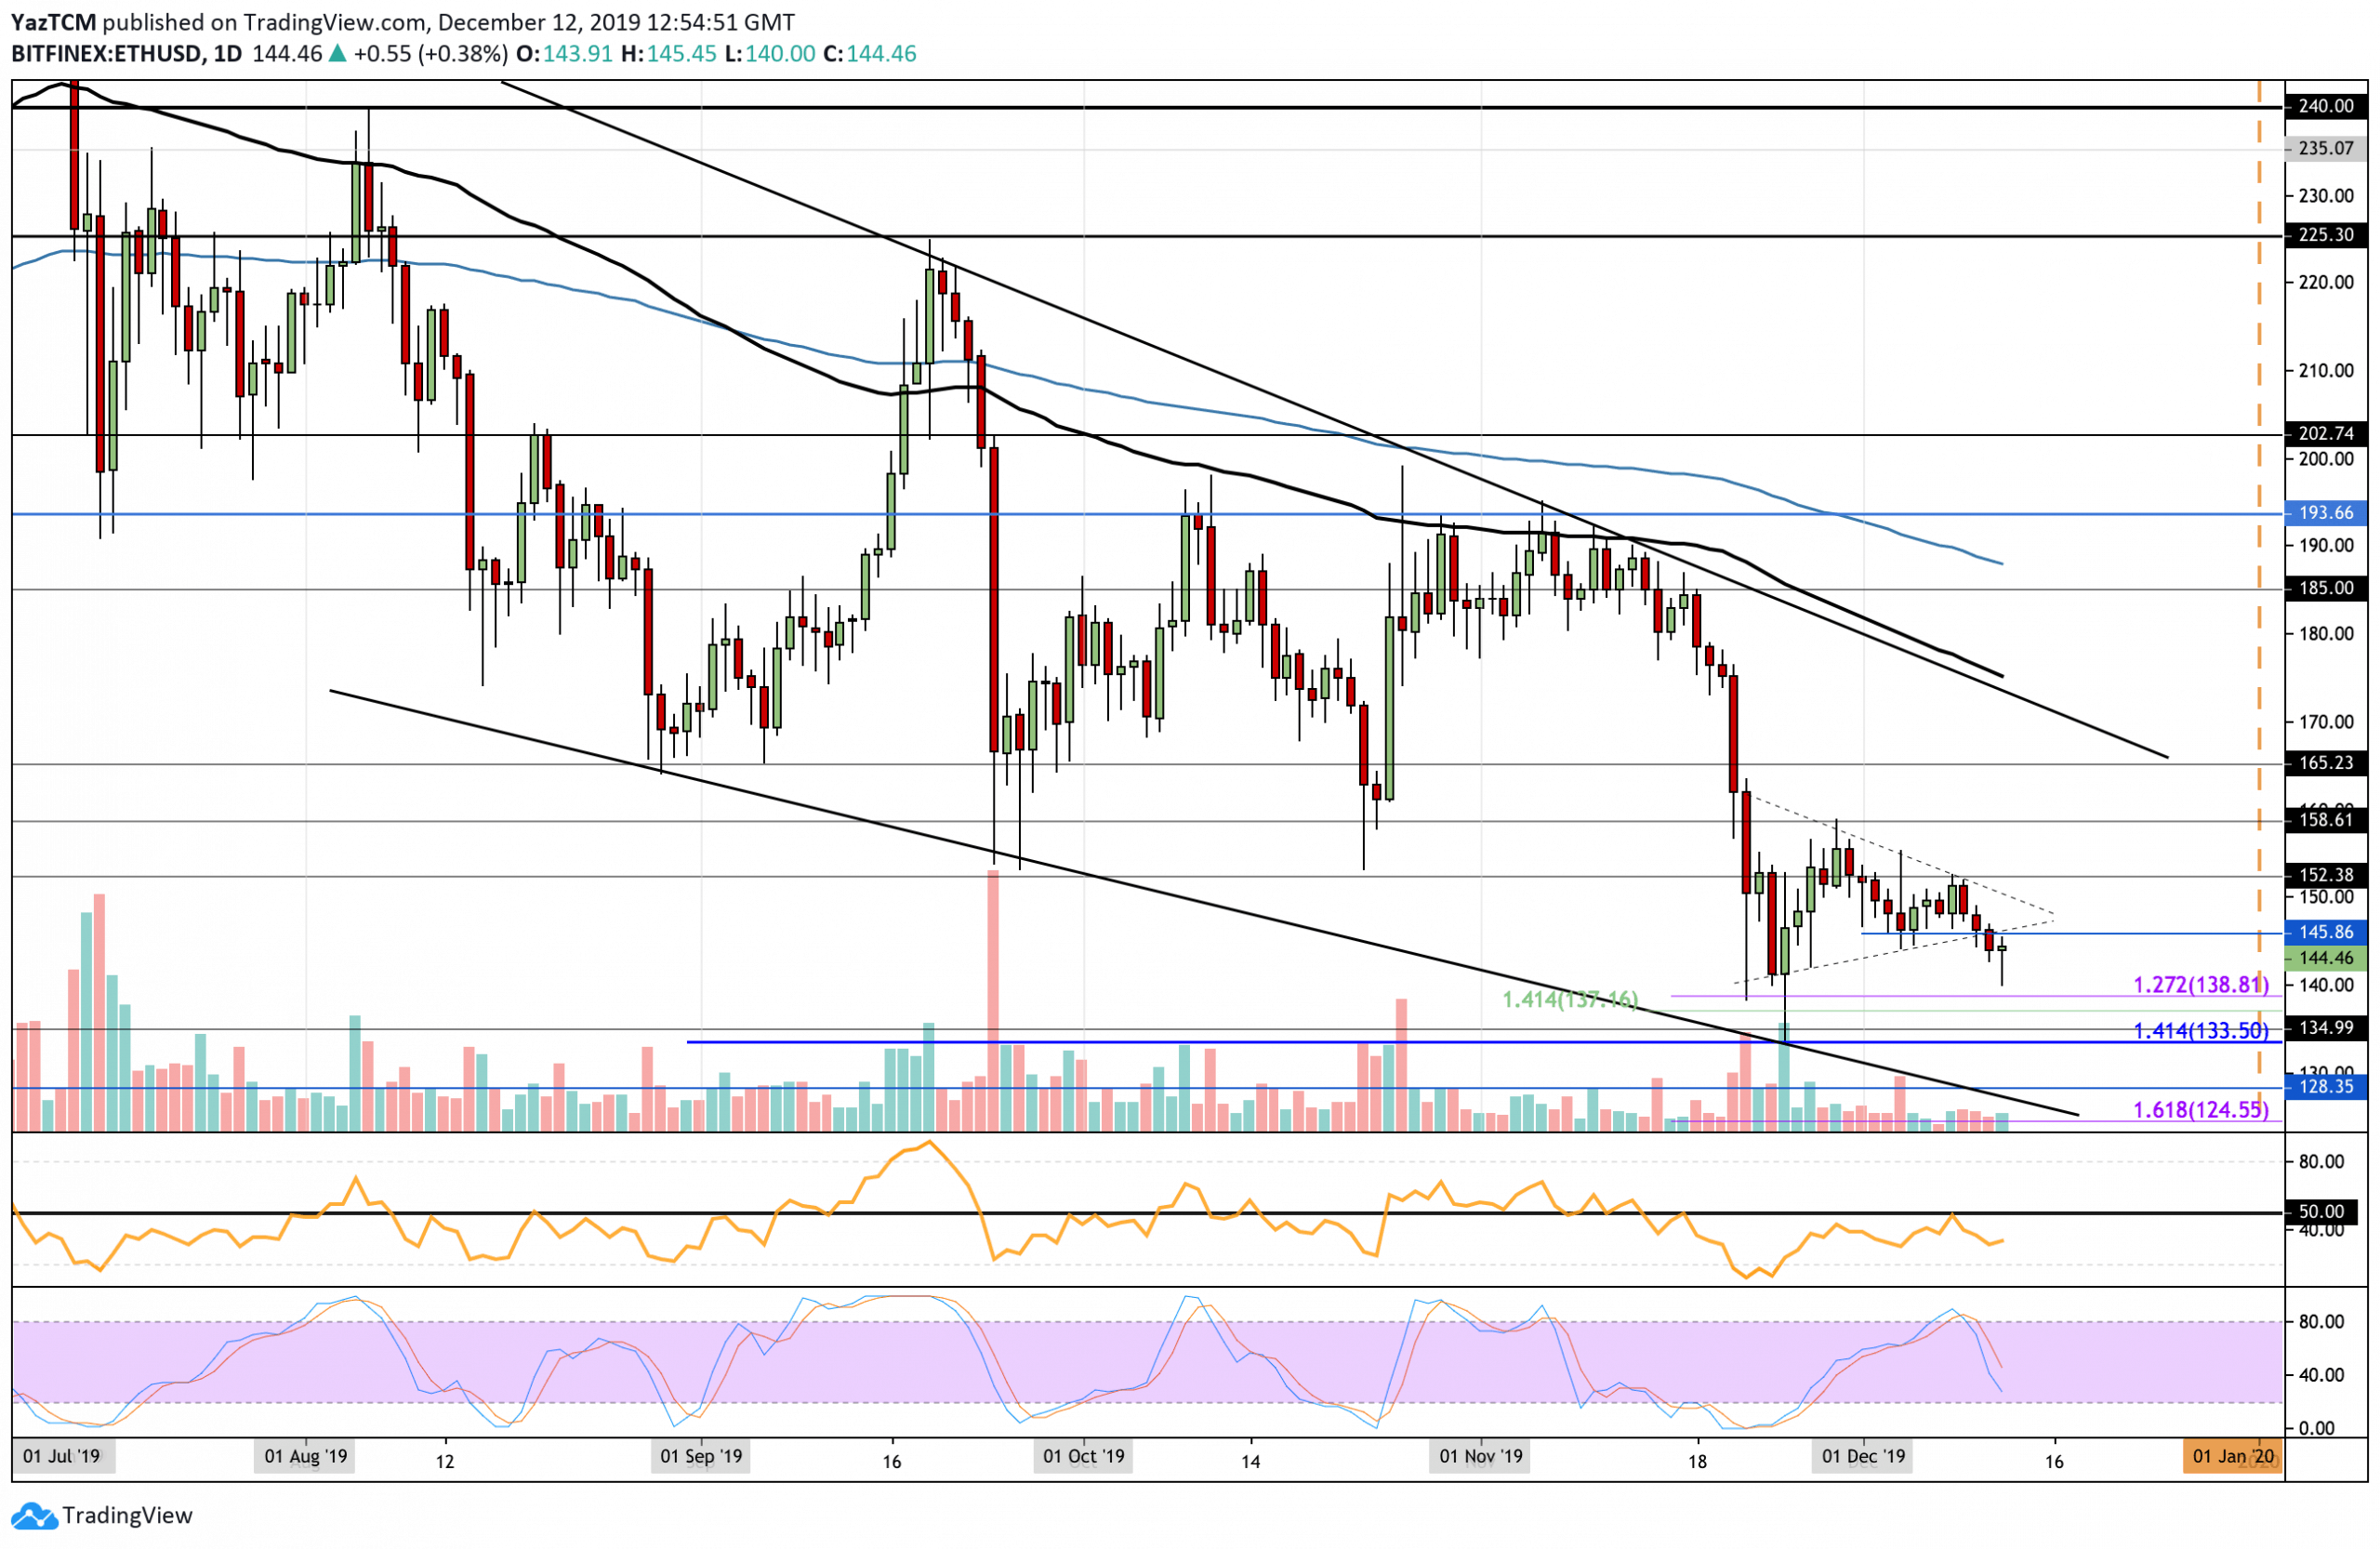
Since our last analysis, ETH continued to struggle with the resistance at the $152 level and eventually rolled over and started to fall. It dropped beneath the previous December support at $145 and continued to make a fresh low at $140.
This latest price decline was expected as the Stochastic RSI had produced a bearish crossover signal, which eventually caused ETH to roll over. The RSI itself remains beneath 50, which shows that the sellers are still in control over the market momentum.
It remains within the wide, 4-month-old, descending price channel and will need to break above this to turn bullish over the longer period.
Ethereum Short Term Price Prediction
If Ethereum was to drop and fall beneath $140, it could be expected that the bearish pressure will push it toward $133.50 (November lows). Alternatively, for some form of bullish recovery, the cryptocurrency needs to start making movements above the $158 level.
Toward the downside, beneath $140, initial support is expected at $137 and $133.50 (downside 1.414 Fibonacci Extension level). Added support is then found at $130 and then at the lower boundary of the descending channel. Alternatively, an initial resistance is located at $145.90. Above this, strong resistance is expected at $152, $158, and $165.

Against Bitcoin, Ethereum has been range-bound between 0.0204 BTC and 0.0196 BTC for the entire period of December. A breakout of the range should dictate which direction the market will be headed toward next. The cryptocurrency broke beneath a short term symmetrical triangle toward the start of December and has been finding resistance at the lower boundary, which hasn’t been breached yet.
If Ethereum were to drop beneath the support at 0.0196 BTC, the coin would turn bearish. To become bullish, it must break above the November high at 0.02177 BTC.
Ethereum Short Term Price Prediction
If the bulls manage to regroup and push higher, an initial resistance is located at 0.0204 BTC. Above this, resistance lies at 0.0208 BTC (100-days EMA), 0.0221 BTC, and then the upper boundary of the previous symmetrical triangle. Toward the downside, initial strong support is located at 0.01966 BTC. Beneath this, support lies at 0.01918 BTC and 0.019 BTC (.618 Fib Retracement).
The RSI is attempting to break above the 50 level, which is a sign that the bulls are trying to take control over the market momentum. However, the Stochastic RSI is warning to remain cautious as it is primed for a bearish crossover signal.
Disclaimer: Information found on CryptoPotato is those of writers quoted. It does not represent the opinions of CryptoPotato on whether to buy, sell, or hold any investments. You are advised to conduct your own research before making any investment decisions. Use provided information at your own risk. See Disclaimer for more information.
Cryptocurrency charts by TradingView.
Technical analysis tools by Coinigy.
Source: cryptopotato.com
View original post


