
Crypto Price Analysis & Overview December 13th: Bitcoin, Ethereum, Ripple, Tezos, and Tron
Bitcoin declined by 2.5% over the last week, dropping to the $7,220 level. The cryptocurrency has been trapped within a tight range between $7,708 and $7,123 for the entire period of December, thus far. A breakout of this range will dictate the direction Bitcoin will head toward over the following weeks.
If the bulls continue to rebound, initial strong resistance is located at $7,400 and $7,700. Above the range, resistance lies at $8,086 (bearish .5 Fibonacci Retracement level) and $8,400 (100-days and 200-days EMA). Alternatively, if the sellers push beneath the lower boundary of the range, support lies at $7,000, $6,900, $6,500 (November low), and $6,270 (downside 1.272 Fib Extension).
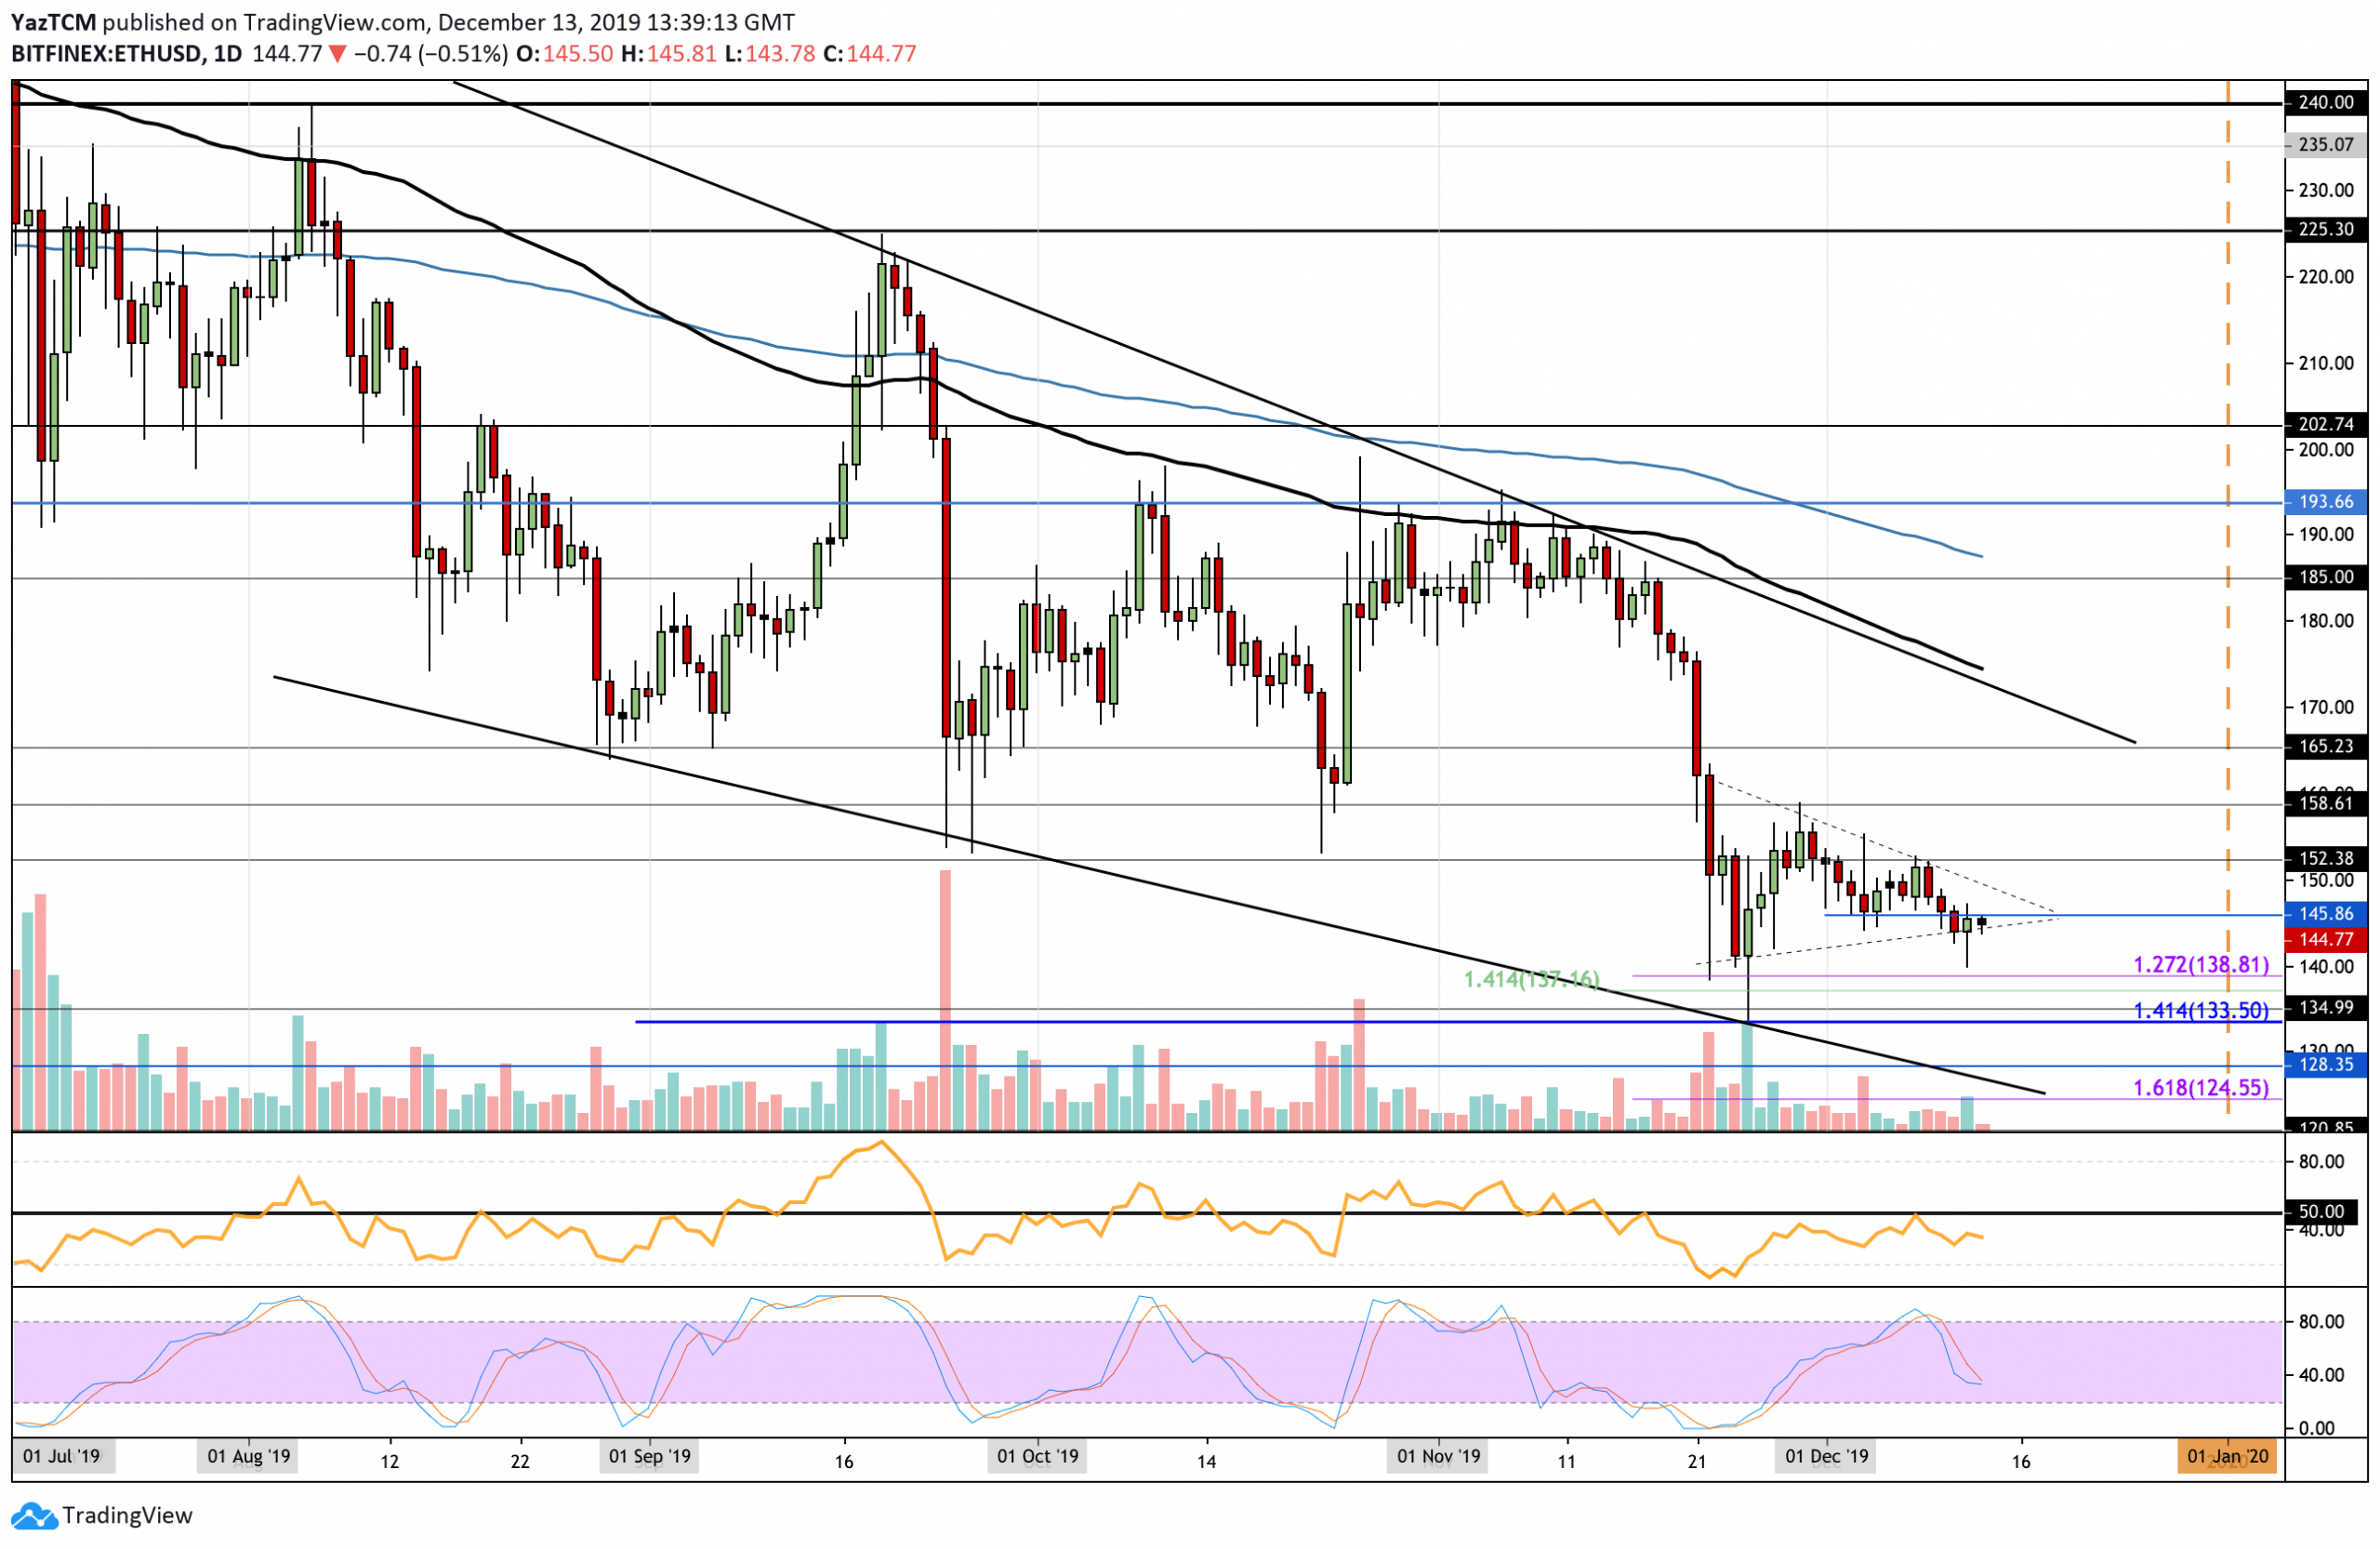
Ethereum was unable to make any ground above the resistance at $152.40 this week, which caused it to roll over and drop beneath the $150 level. ETH is trapped within an acute symmetrical triangle at this moment, but the market looks primed to drop beneath the lower boundary.
From above, the nearest level of resistance is expected at the upper boundary of the triangle and then at $152.40. Above this, resistance can be found at $138.60, $165.23, $175 (100-days EMA), and $185. Alternatively, toward the downside, support is seen at $140, $138.81, and $137.16. Beneath this, added support is located at $133.50 (November low and downside 1.414 Fib Extension).
Against Bitcoin, Ethereum broke beneath the previous symmetrical triangle but has established a new boundary that held. For trading in December, ETH has been trapped between 0.0205 BTC and 0.0196 BTC and must pass this range to dictate the next move.
Toward the downside, initial support is located at 0.0196 BTC. Beneath this, support can be found at 0.019 BTC (.618 Fib Retracement), 0.0194 BTC (downside 1.618 Fib Extension), and 0.0179 BTC. On the other hand, if the bulls push higher, initial resistance relies at 0.0205 BTC and 0.0208 BTC (100-days EMA). Beyond this, resistance is located at the upper boundary of the triangle and at 0.0218 (November highs).

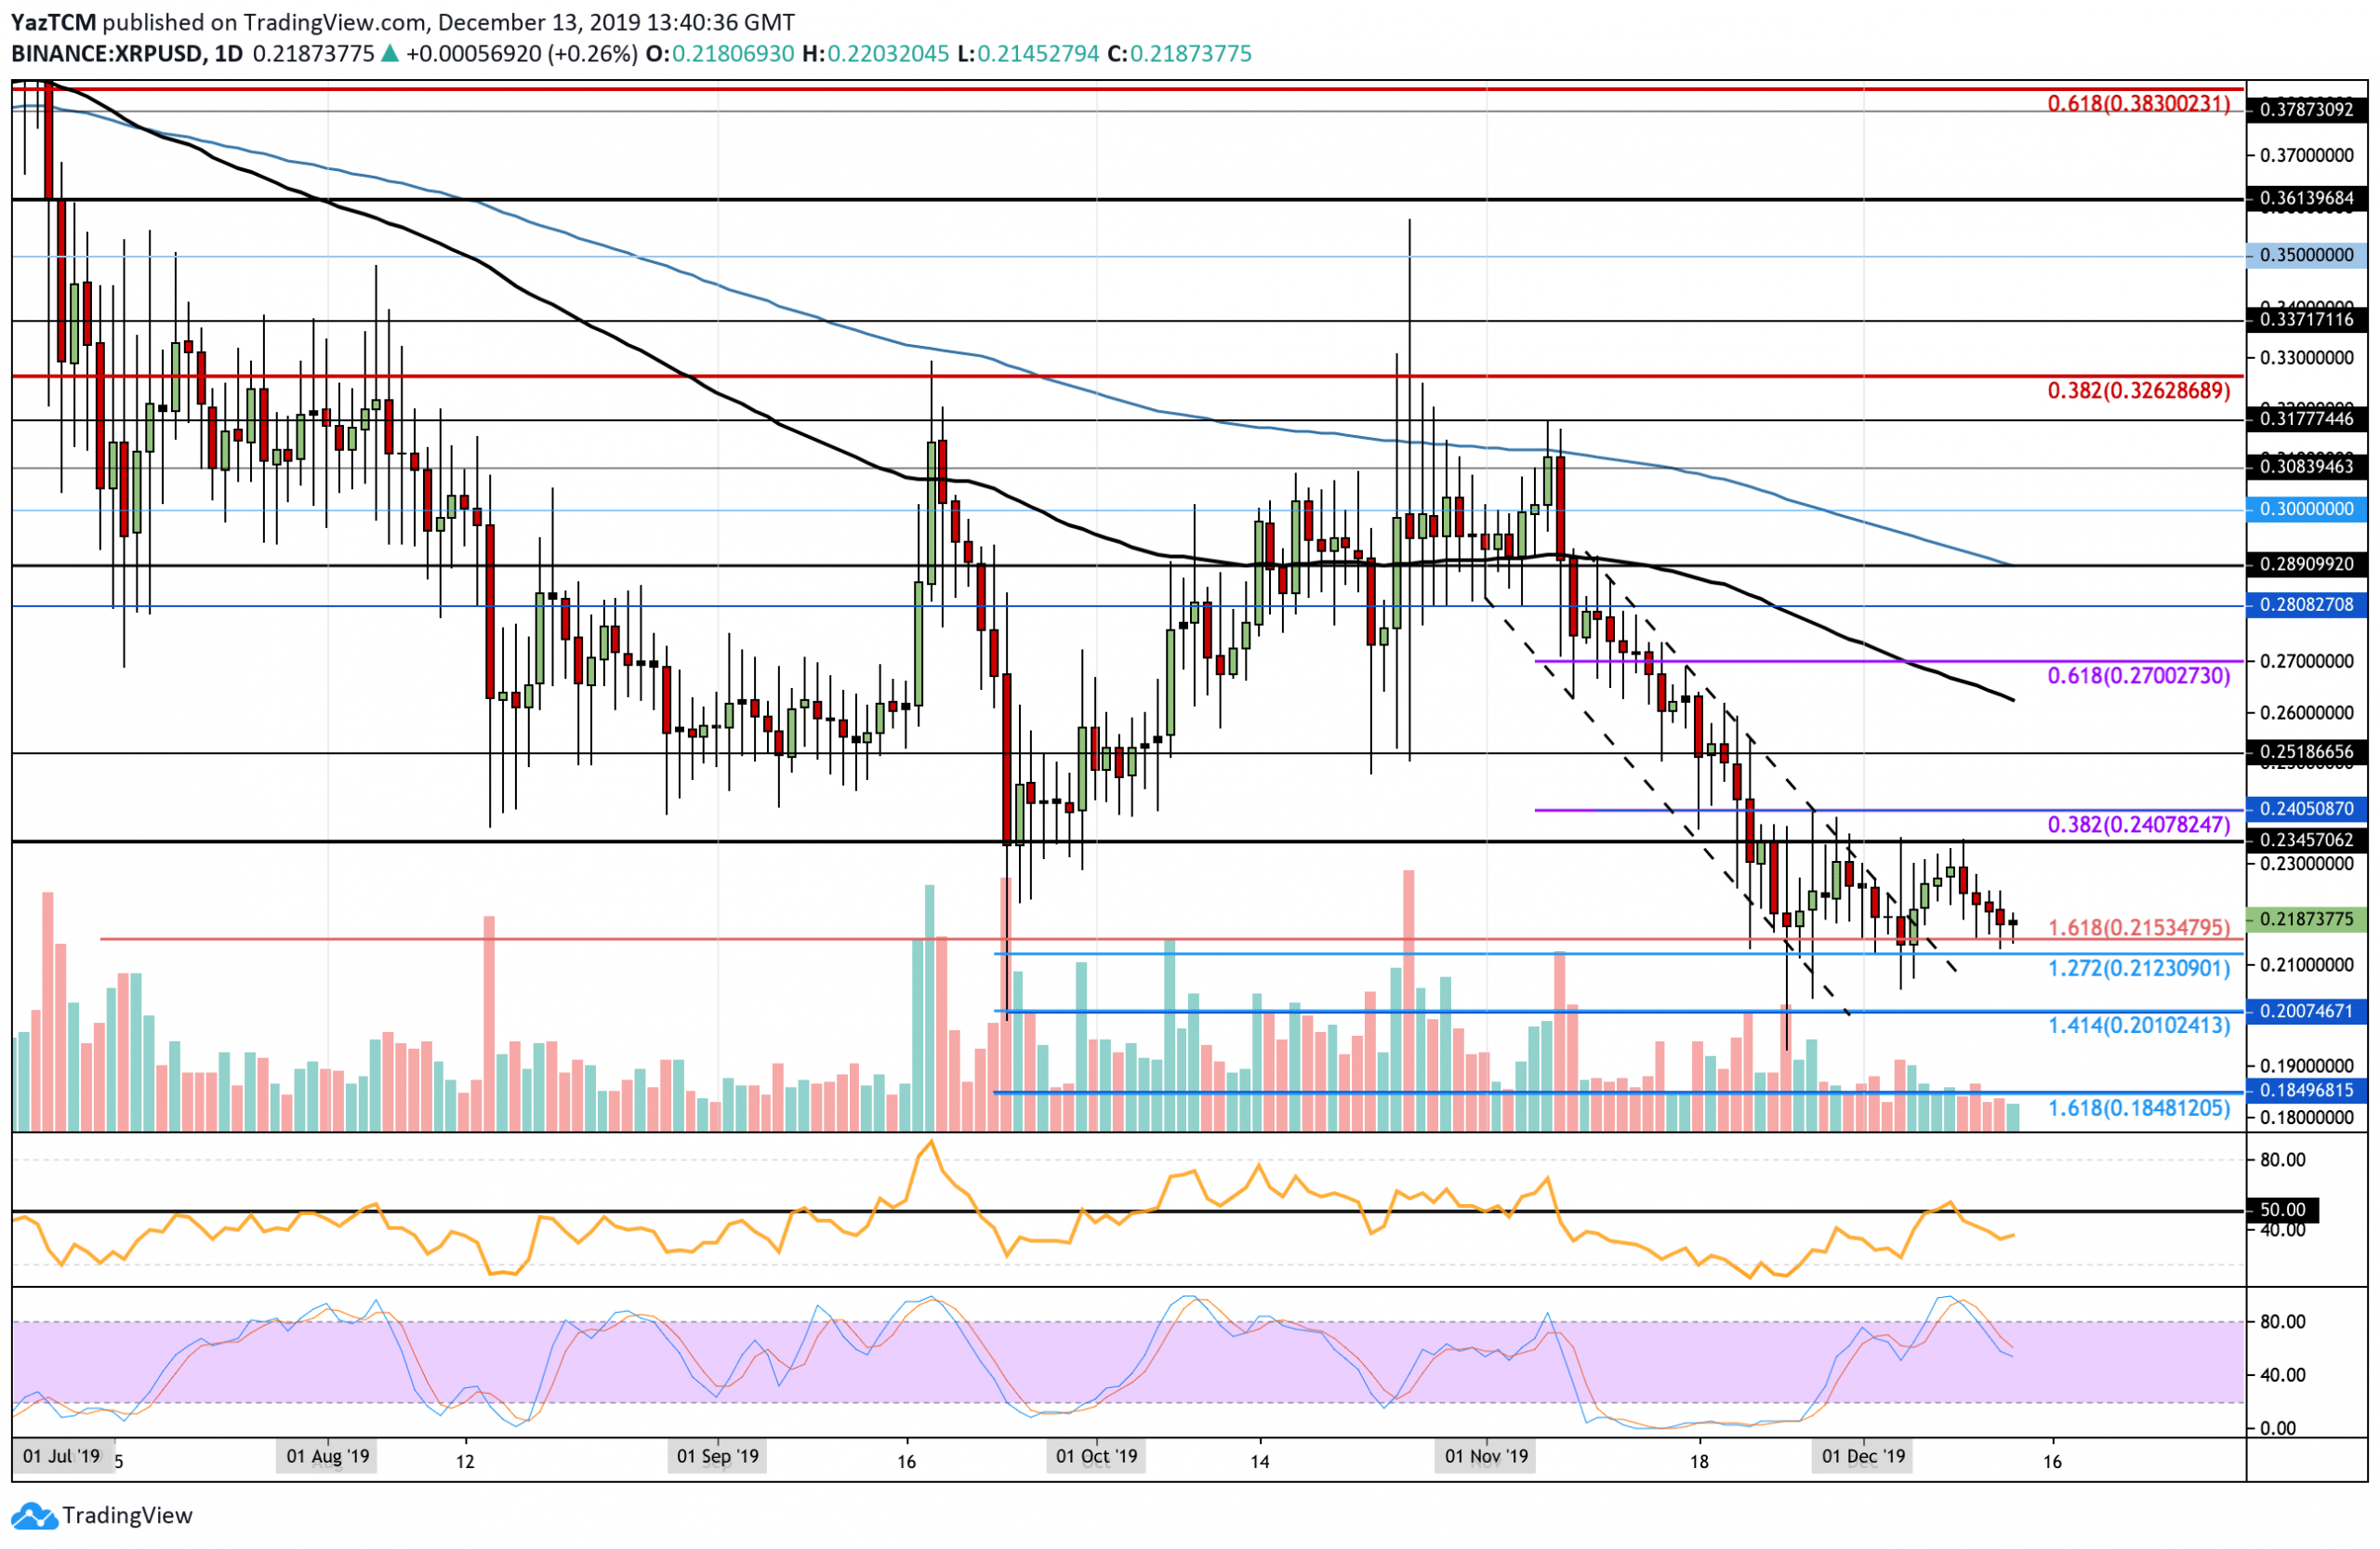
Since breaking the previous descending triangle, XRP has finally started to trade sideways as it sits between the range of $0.2150 and $0.2345. The fact that it has left the previous steep descending channel is promising, however, if it falls beneath the $0.215 support, XRP may see some fresh multi-year lows.
If the bulls rebound from the current $0.2150 support, initial strong resistance is expected at the upper boundary of the range at $0.2345. Above this, resistance lies at $0.24 (bearish .382 Fib Retracement), $0.252, and $0.262 (100-days EMA). Alternatively, if the sellers push beneath the $0.215 support, added support is found at $0.211, $0.21, and $0.20.
Against BTC, XRP performed remarkably well as it remains above the 3000 SAT level. The cryptocurrency is trapped within a falling wedge and recently rolled over at resistance provided by the upper boundary. The momentum looks strongly within the bearish favor, which could potentially cause XRP to drop below the 3000 SAT support this week.
If the bulls hold at 3000 SAT and start to climb, an initial resistance is expected at the upper boundary of the falling wedge. Above this, resistance lies at 3115 SAT, 3170 SAT (100-days EMA), and 3500 SAT. On the other hand, support beneath 3000 SAT can be found at 2900 SAT (.618 Fib Retracement), 2853 SAT, and 2750 SAT.

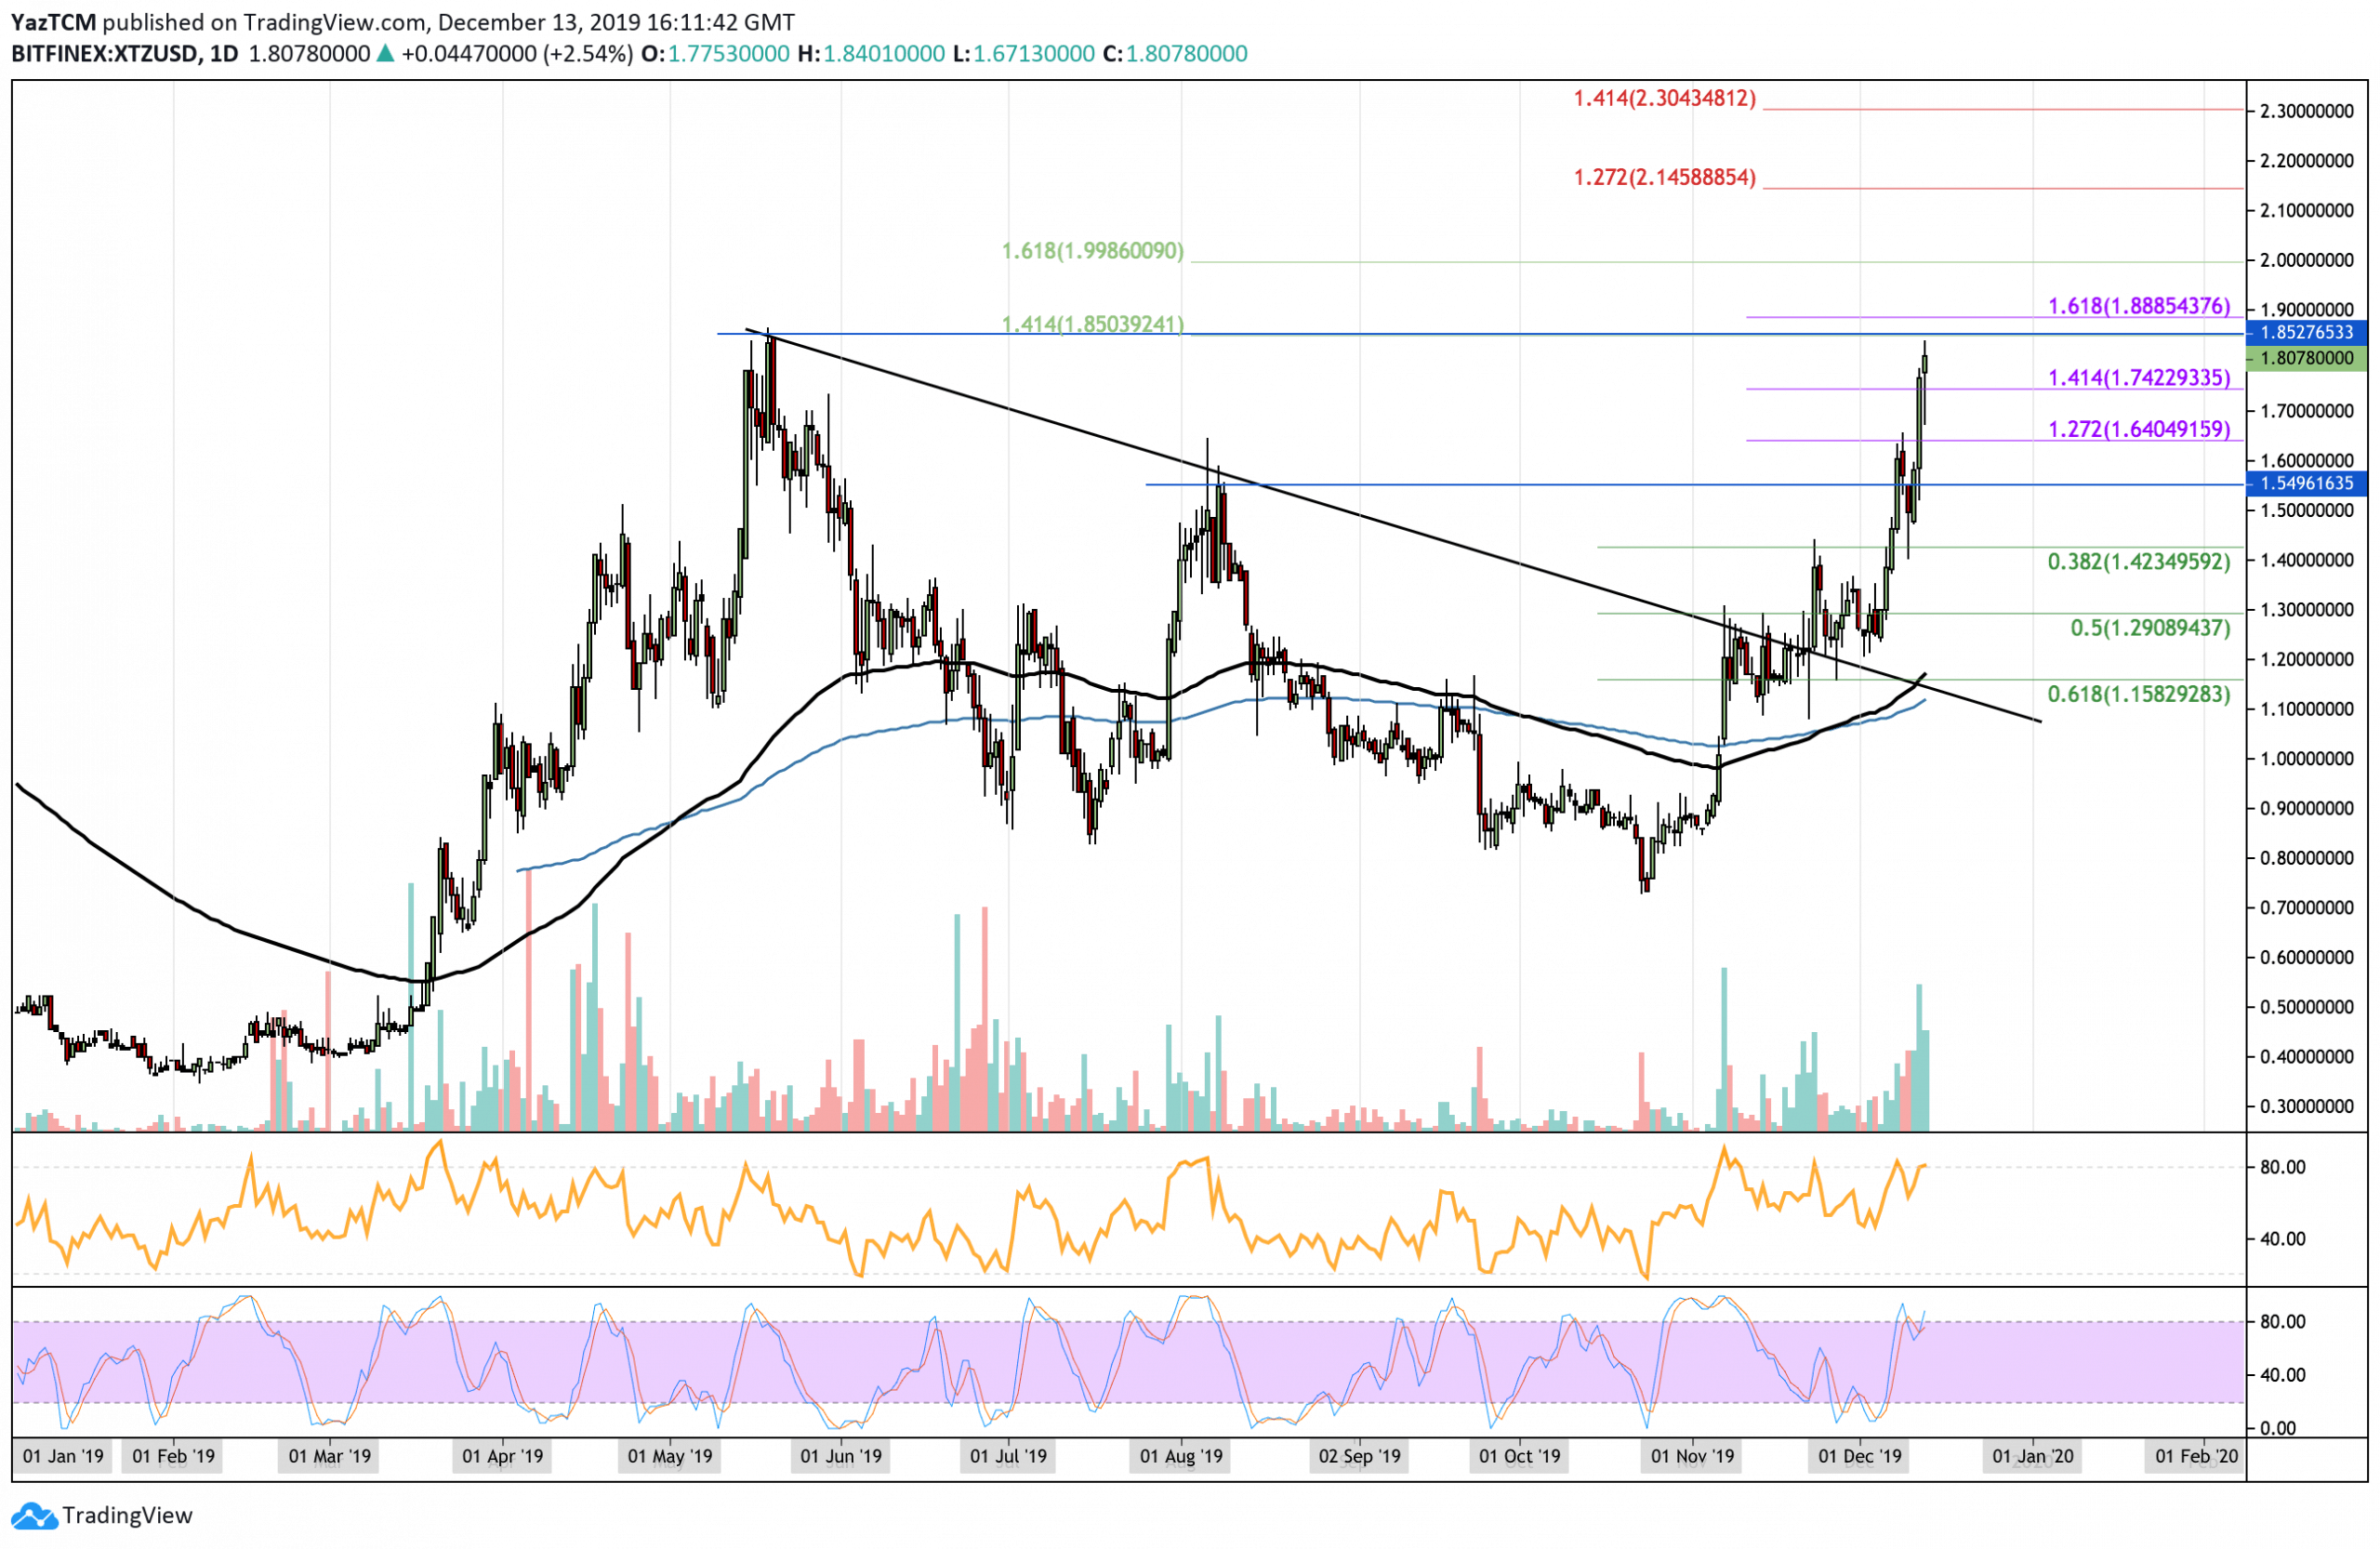
Tezos witnessed another remarkable week after surging by a total of 33% to reach the $1.80 level. XTZ recently produced a strong bullish signal as the 100-days EMA crossed the 200-days toward the start of December. The cryptocurrency has now surged into the 10th ranked position with a market cap of $1.14 billion. It recently met resistance at $1.68 which it must pass for the bull run to continue.
From above, an initial resistance is expected at $1.85 (May highs) and $1.88. Beyond this, resistance can be found at the $2.00 handle. If the buyers break $2.00, resistance can be located at $2.14 (1.272 Fib Extension) and $2.30 (1.414 Fibonacci Extension). Alternatively, if the sellers pressure the market lower, support can be found at $1.74, $1.65, $1.54, and $1.42.
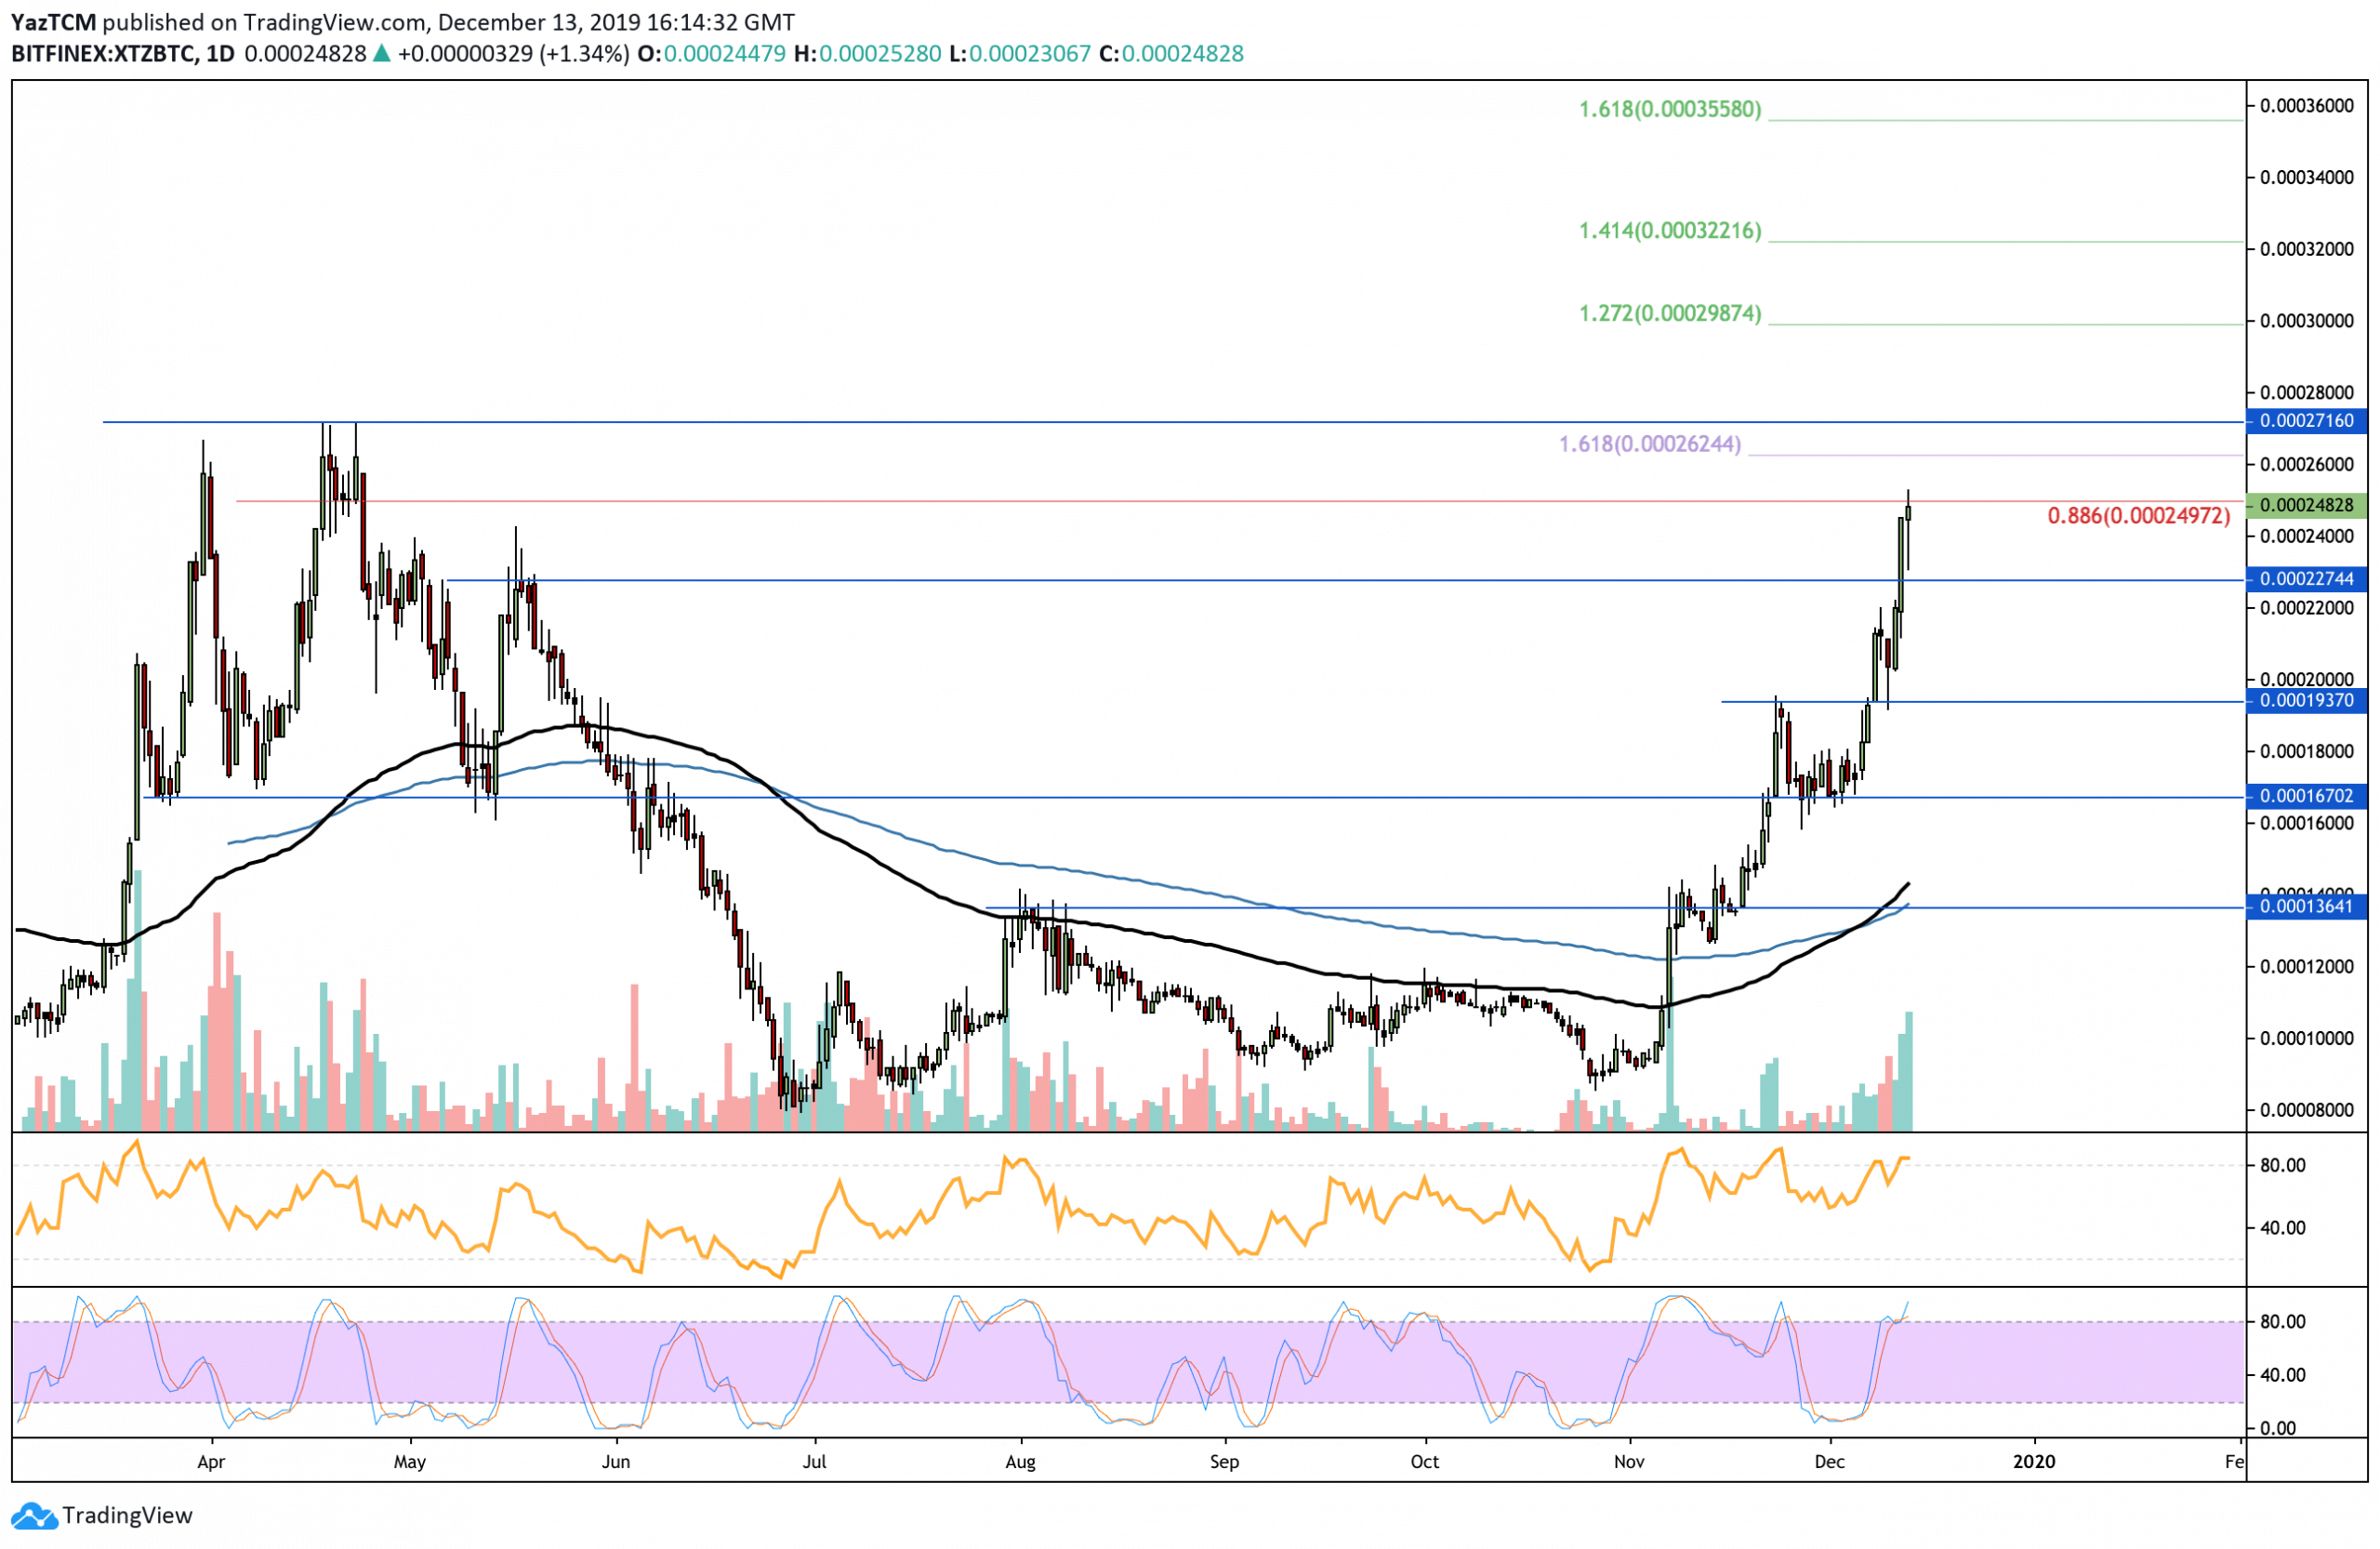
Tezos performed very well against Bitcoin as it climbs toward the 0.00025 BTC level. This market has also produced a strong signal as the 100-days EMA crosses above the 200-days EMA.
From above, the nearest level of resistance lies at 0.00025 BTC. Above this, resistance can be found at 0.0002624 BTC and 0.0002716 BTC (April highs). Added resistance can be expected at 0.000030 BTC and 0.000322 BTC (1.414 Fib Extension). Toward the downside, support can be found at 0.00024 BTC. Beneath this, support can be found at 0.00022 BTC, 0.00020 BTC, and 0.0001937 BTC.
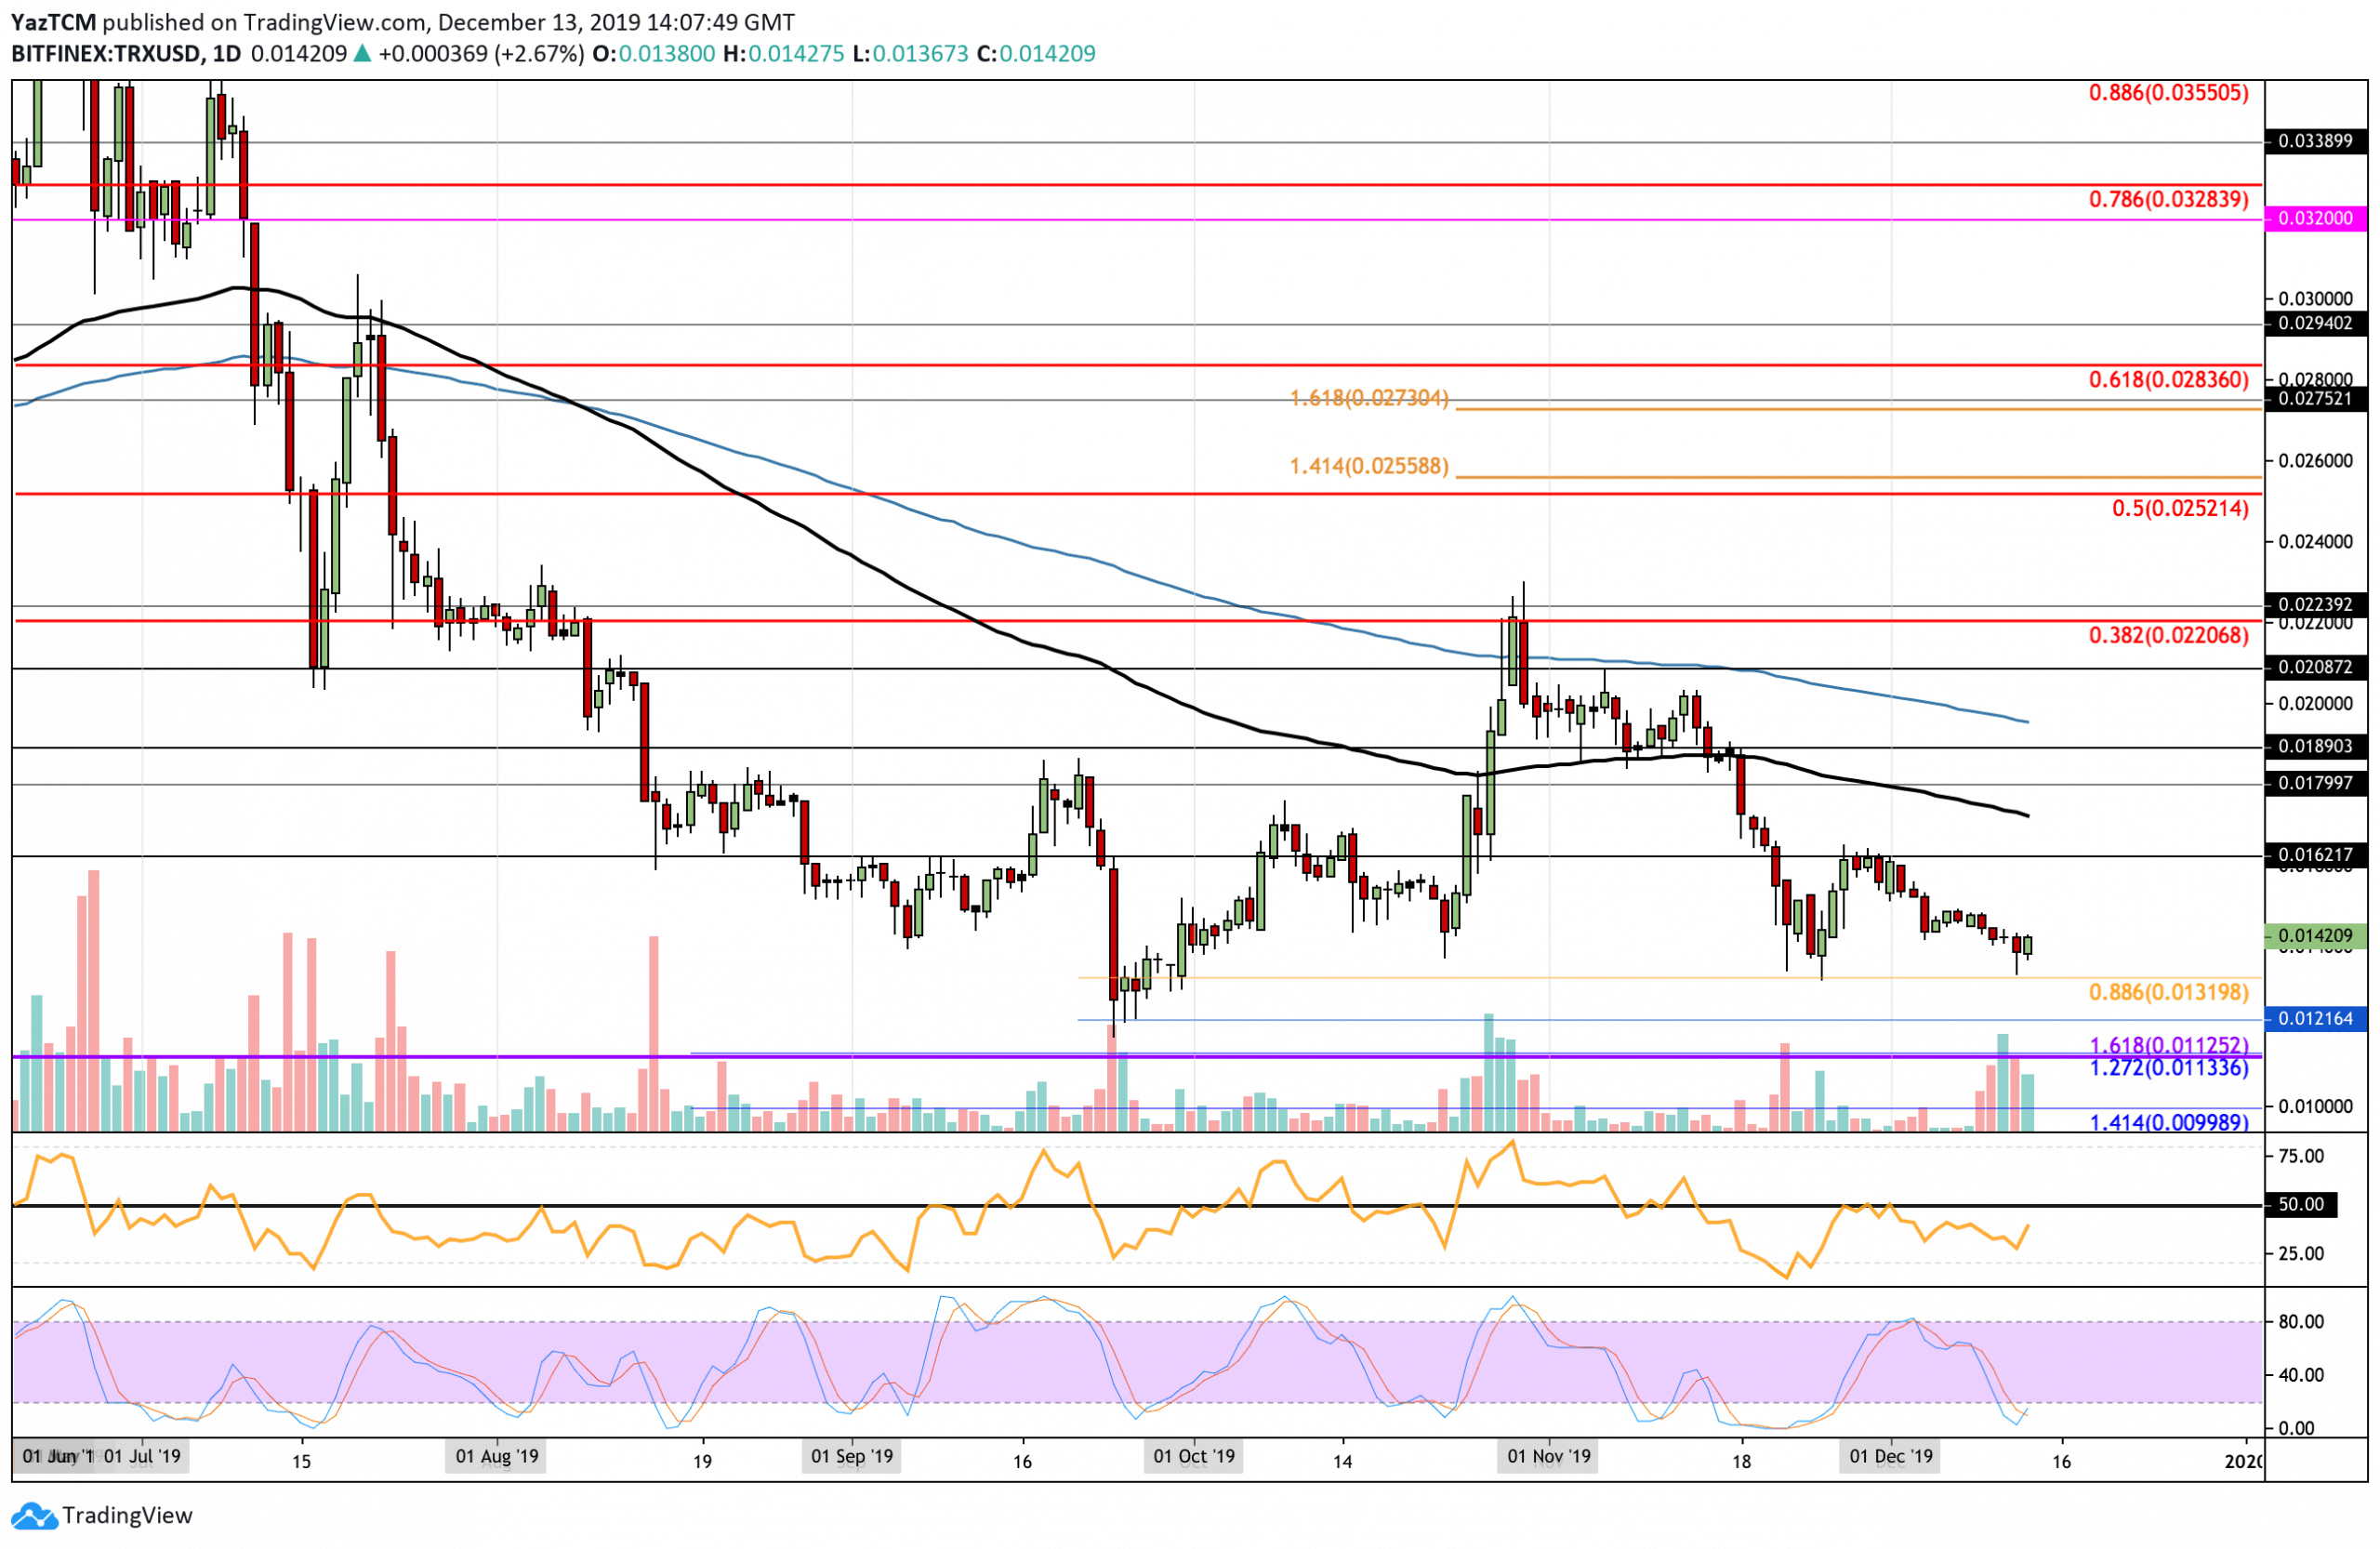
Tron suffered a small 3% price decline over the past week as it trades around the $0.014 level. The cryptocurrency found support at the November low, which allowed TRX to rebound slightly. The Stochastic RSI has recently produced a bullish crossover signal that could potentially start a bullish run for it.
From above, the nearest level of resistance lies at $0.0162. Above this, resistance lies at $0.01722 (100-days EMA), $0.0195 (200-days EMA), and $0.021 (November highs). Alternatively, if the sellers push the market lower, strong support is expected at $0.01320, which is the November low and short term .886 Fib Retracement level. Beneath this, support lies at $0.01215 and 0.01125.
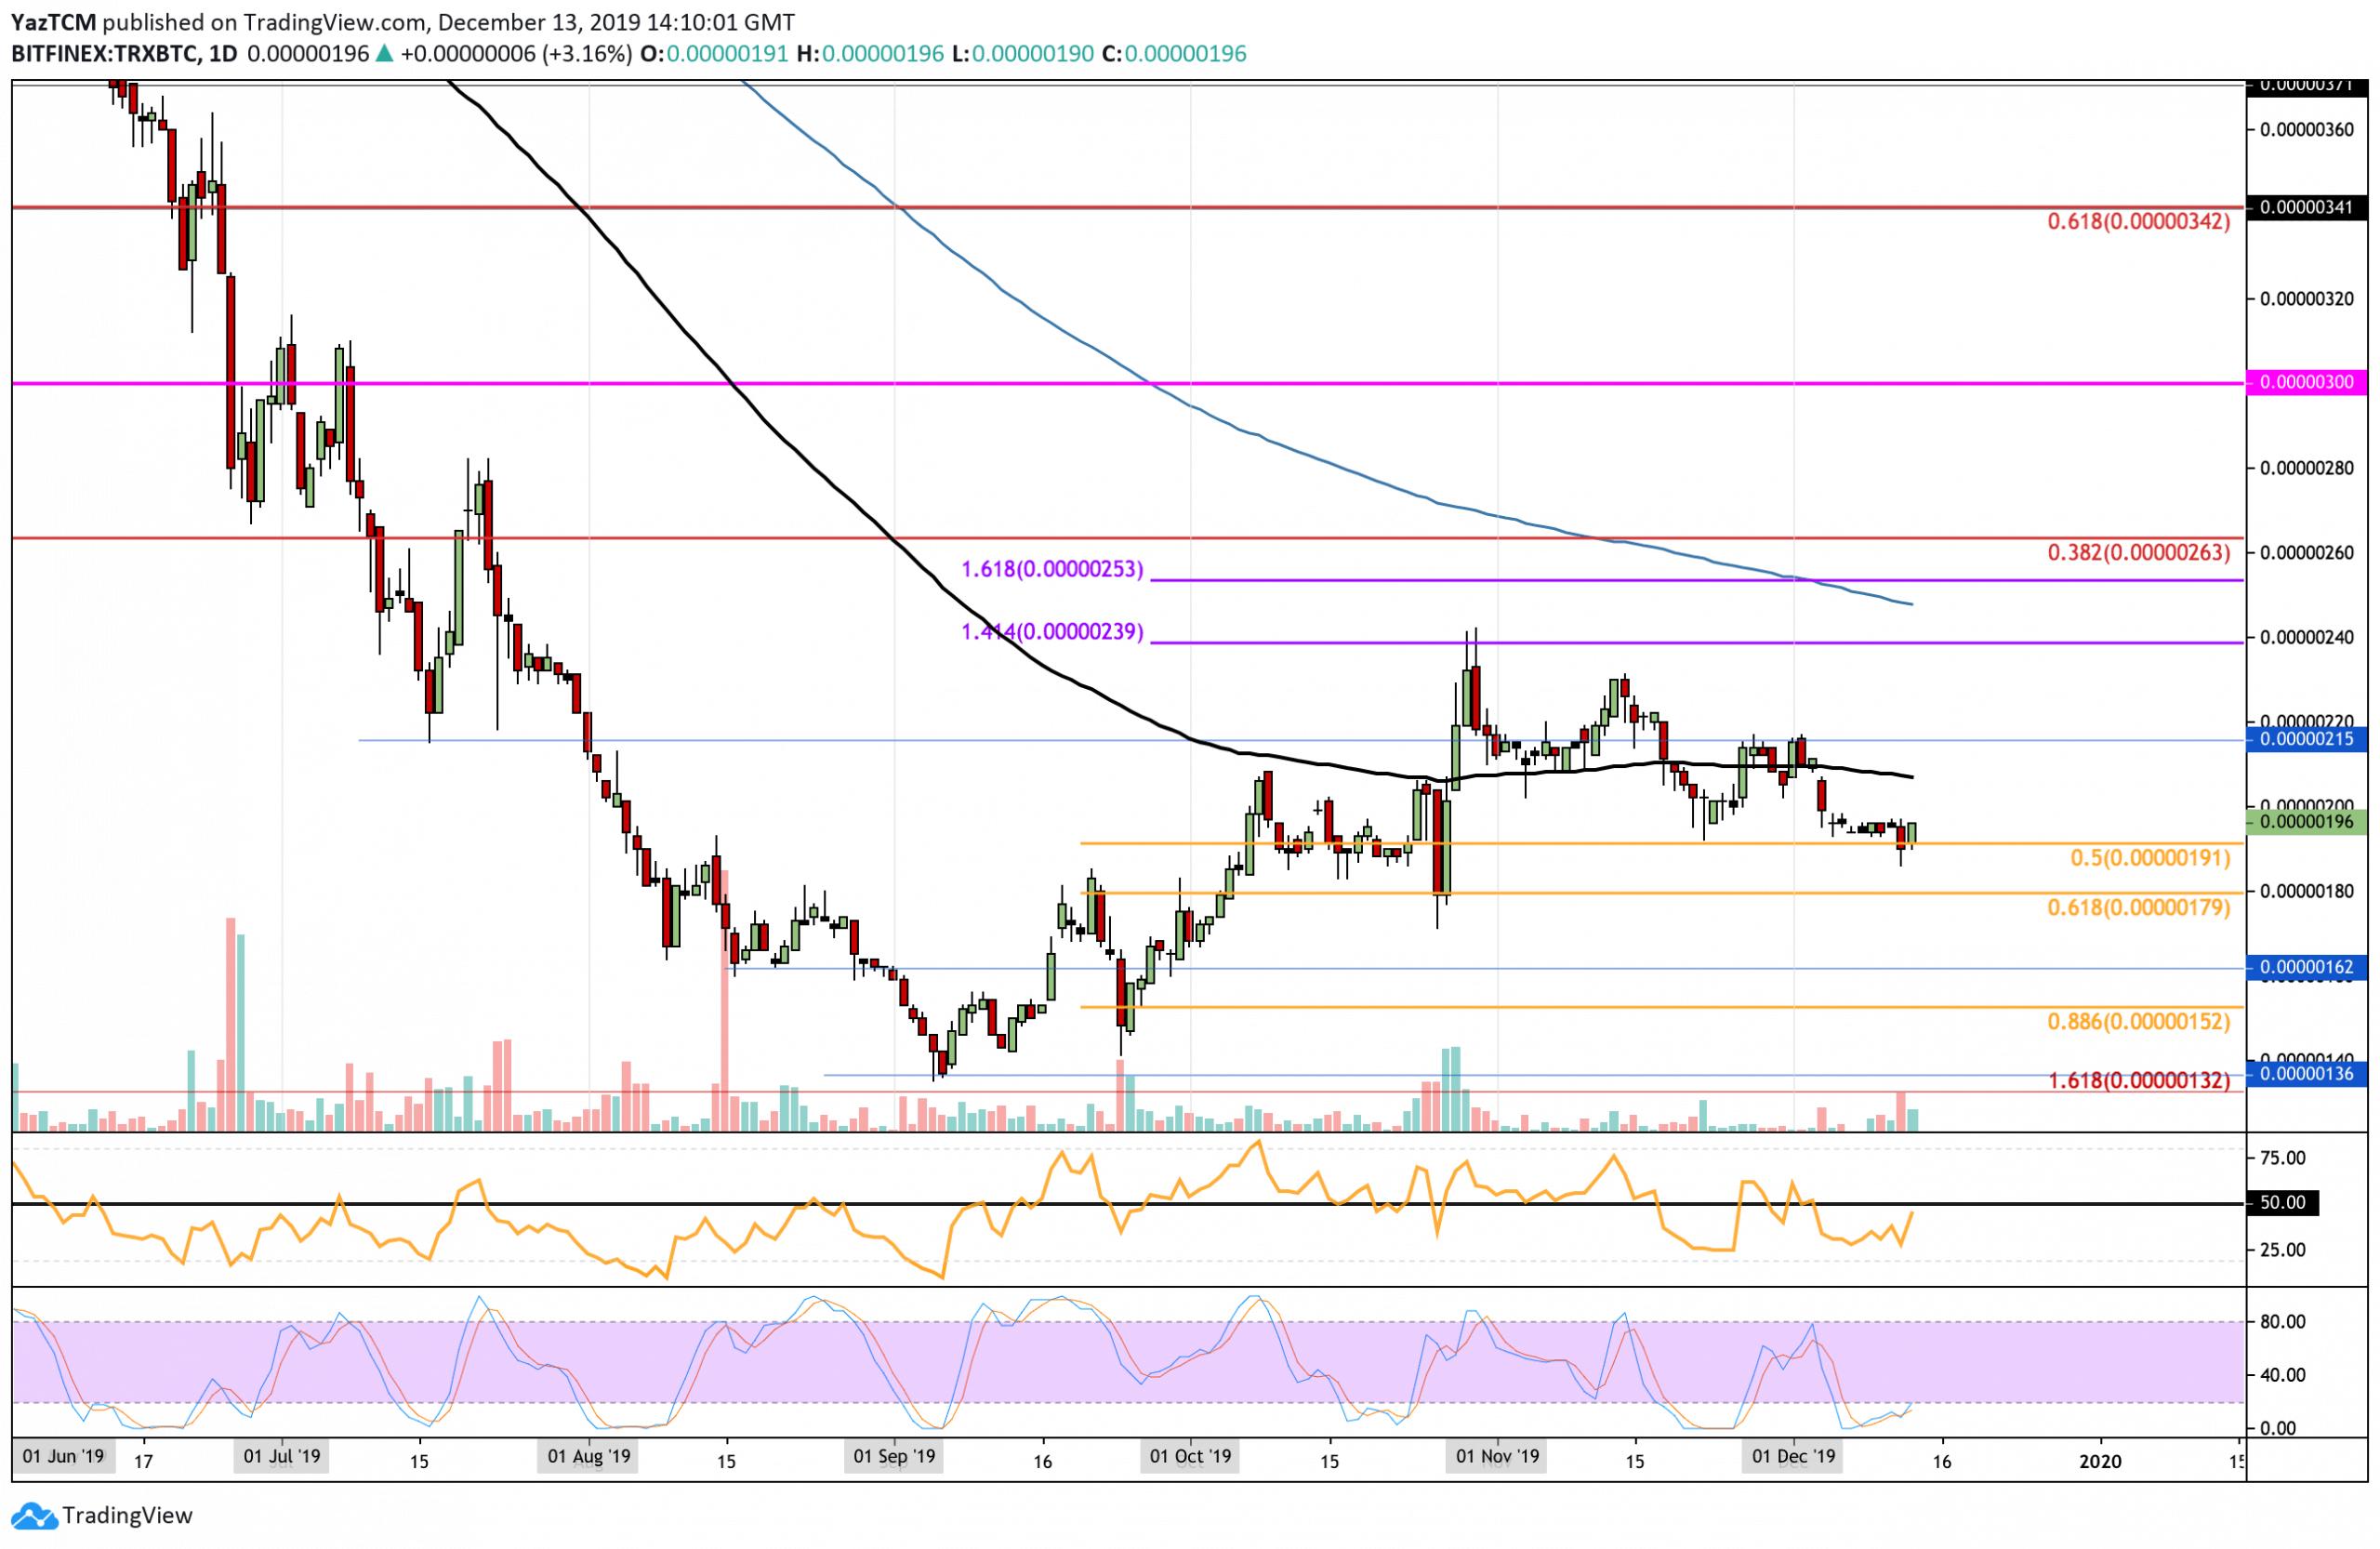
Against BTC, Tron has struggled during December after dropping into the 190 SAT support level. If Tron was to continue beneath 190 SAT, then the market would be considered as bearish. Nevertheless, the Stochastic RSI is primed for a bullish crossover signal that should send it higher.
From above, the nearest level of resistance lies at 207 SAT (100-days EMA). Beyond this, resistance lies at 215 SAT, 240 SAT, and 253 SAT. If the sellers push Tron beneath 190 SAT, we can expect strong support at 180 SAT, 162 SAT, and 152 SAT (.886 Fib Retracement).
Disclaimer: Information found on CryptoPotato is those of writers quoted. It does not represent the opinions of CryptoPotato on whether to buy, sell, or hold any investments. You are advised to conduct your own research before making any investment decisions. Use provided information at your own risk. See Disclaimer for more information.
Cryptocurrency charts by TradingView.
Technical analysis tools by Coinigy.
Source: cryptopotato.com
View original post