Stellar Lumen (XLM) Price Trimming Gains, More Downsides Likely
- Stellar lumen price failed to settle above the $0.0800 and $0.0820 resistances against the US Dollar.
- XLM price is currently declining and it is now trading well below the $0.0750 level.
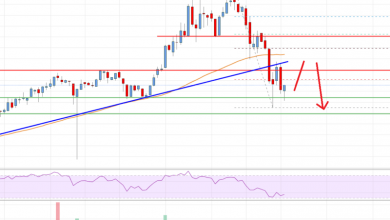
- There is a major bearish trend line forming with resistance near $0.0730 on the 4-hours chart (data feed via Kraken).
- The pair remains at a risk of more downsides towards the key $0.0650 support area.
Stellar lumen price is currently trimming gains against the US Dollar and bitcoin. XLM price could continue to decline towards the $0.0680 and $0.0650 supports.
Stellar Lumen Price Analysis (XLM to USD)
This past week, stellar lumen price made a couple of attempts to surpass the $0.0820 resistance area against the US Dollar. However, the XLM/USD pair failed to settle above $0.0800 and started a fresh decline.
The price broke the $0.0780 and $0.0750 support levels to move into a bearish zone. It opened the doors for more losses below the 61.8% Fibonacci retracement level of the upward move from the $0.0681 low to $0.0825 high.
Moreover, there was a close below the $0.0750 support and the 55 simple moving average (4-hours). Stellar price is now trading below the 76.4% Fibonacci retracement level of the upward move from the $0.0681 low to $0.0825 high.
An immediate support is near the $0.0680 level (the previous swing low). If there are more losses, the price may perhaps decline towards the $0.0650 support area.
Additionally, the 1.236 Fib extension level of the upward move from the $0.0681 low to $0.0825 high is also near the $0.0648 level to provide support. Any further losses could push the price towards the $0.0620 and $0.0600 support levels.
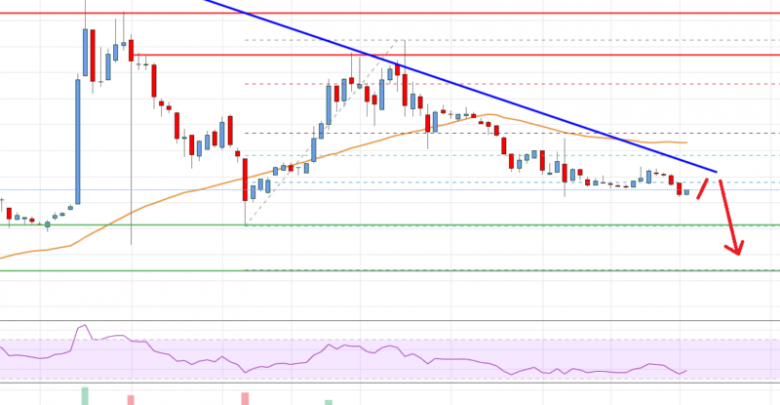
On the upside, an initial resistance is near the $0.0720 level. Besides, there is a major bearish trend line forming with resistance near $0.0730 on the 4-hours chart.
More importantly, the price must break the $0.0750 resistance and the 55 simple moving average (4-hours) to start a fresh increase. The next key resistances above $0.0750 are near the $0.0800 and $0.0820 levels. Any further increase could set the tone for a push towards the $0.0900 area.

Stellar Lumen Price
The chart indicates that XLM price is clearly trimming gains and about to reach the last swing low at $0.0680. The bears may even eye a test the $0.0650 support area. Finally, the price is likely to bounce back after it completes the current correction either near $0.0680 or $0.0650.
Technical Indicators
4 hours MACD – The MACD for XLM/USD is slowly losing momentum in the bearish zone.
4 hours RSI – The RSI for XLM/USD is currently correcting lower and it might test the 45 level.
Key Support Levels – $0.0680 and $0.0650.
Key Resistance Levels – $0.0730, $0.0750 and $0.0800.
Source: investing.com
View original post