Ripple Price Analysis
Ripple Price Analysis: XRP Falls Below $0.26 But A Bullish Crossover Could Suggest A Trend Reversal
XRP saw a small decline of around 1.42% over the past 24 hours and it currently trades at $0.2590. The cryptocurrency has seen a further drop of 10.63% over the past week and it fell below the support at $0.26.
XRP remains the third-largest cryptocurrency with a market cap of $11.35 billion.
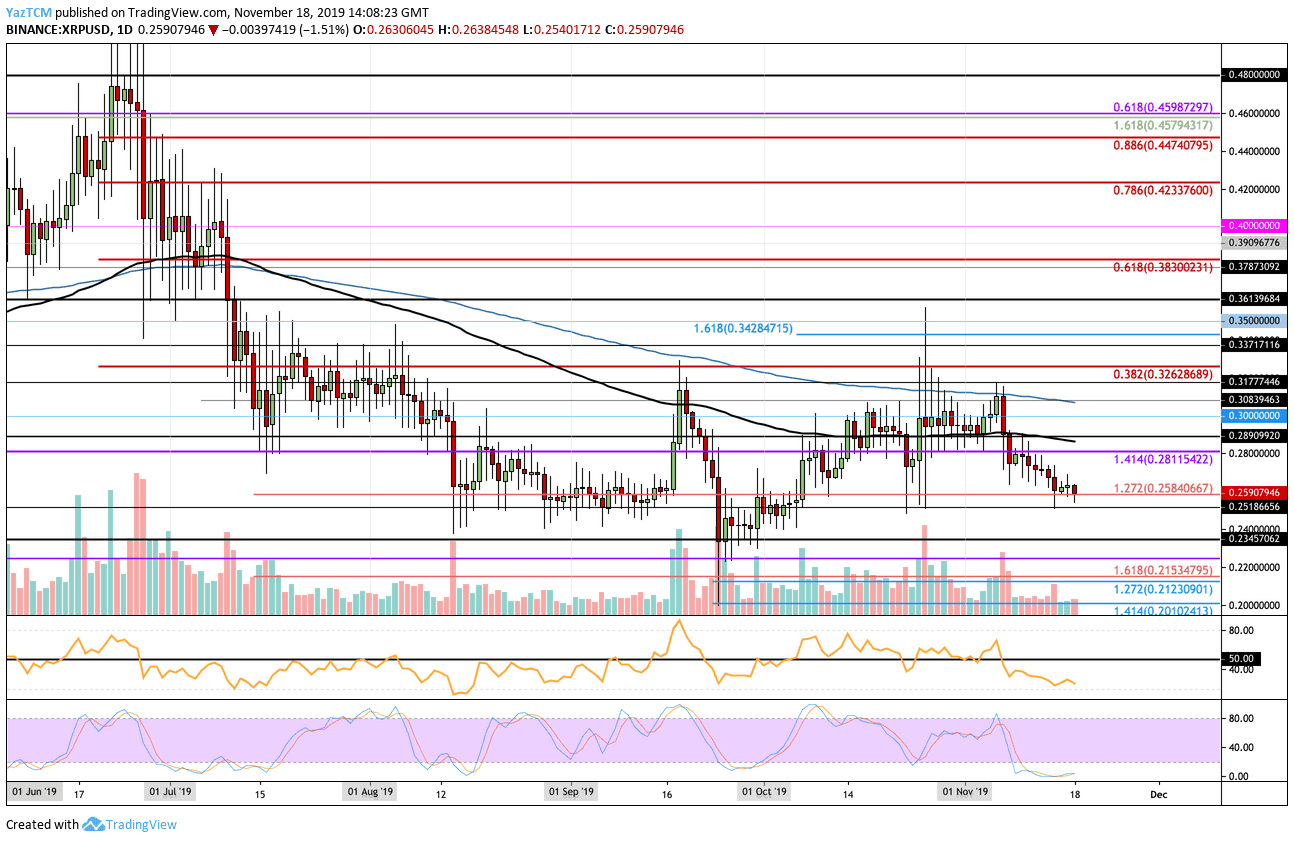
Looking at the XRP/USD 1-Day Chart:
- Since our last analysis, XRP continued to go lower below the support at $0.2670 until reaching $0.2584.
- From above: The nearest level of resistance lies at $0.2811. Above it, resistance lies at $2880 (100-days EMA) and $0.2890. Following this, resistance is found at at $0.30, $0.308 (200-days EMA), $0.3177, and $0.3262 (bearish .382 Fib Retracement).
- From below: The nearest level of support lies at $0.2584. Beneath it, support can be found at $0.2518 and $0.25. Further support is expected at $0.24, $0.2345, $0.22, and $0.2153.
- The trading volume remains high but is diminishing slowly.
- The RSI is well beneath the 50 level which shows that the sellers are in complete control over the market momentum. However, the Stochastic RSI has been in oversold conditions for a while, as we wait for a bullish crossover signal to send the market higher.
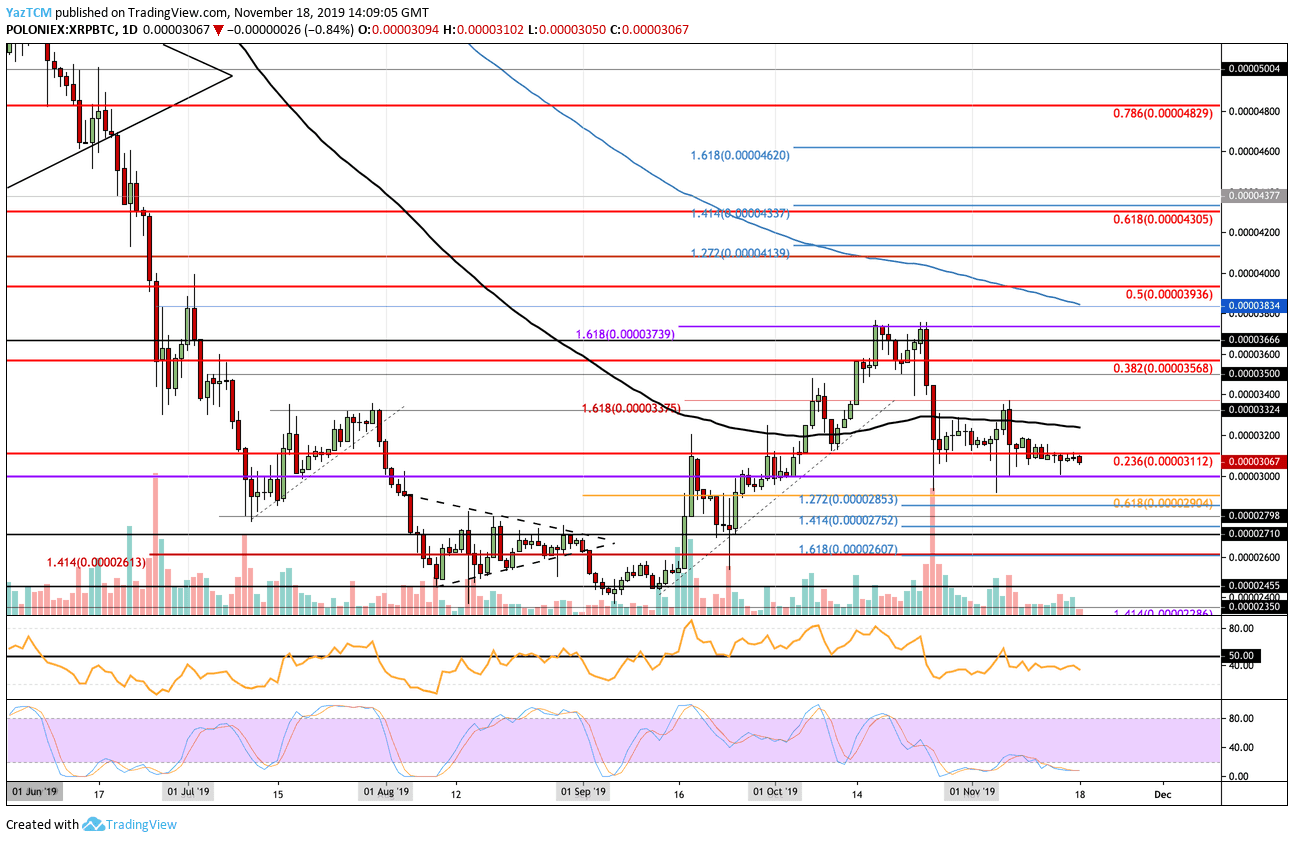
Looking at the XRP/BTC 1-Day Chart:
- Against Bitcoin, XRP has pretty much traded sideways as it managed to remain supported above the 3000 SAT level.
- From above: The nearest level of resistance lies at 3112 SAT. Above this, resistance is found at 3200 SAT (100-days EMA), 3324 SAT, 3375 SAT, and 3500 SAT. Following this, resistance can be expected at 3568 SAT (bearish .382 Fib Retracement), 3666 SAT, and 3739 SAT.
- From below: The nearest level of support lies at 3000 SAT. Beneath this, support is found at 2904 SAT (.618 Fib Ret), 2853 SAT, 2798 SAT, 2752 SAT, 2710 SAT, and 3607 SAT.
- The trading volume is also slowly diminishing here.
- The RSI is marginally below the 50 level to show a weak bearish dominance. The Stochastic RSI is in oversold conditions as we wait for a bullish crossover signal to send the market higher.
Click here to start trading on BitMEX exchange and receive 10% discount on fees for 6 months.
Disclaimer: Information found on CryptoPotato is those of writers quoted. It does not represent the opinions of CryptoPotato on whether to buy, sell, or hold any investments. You are advised to conduct your own research before making any investment decisions. Use provided information at your own risk. See Disclaimer for more information.
Cryptocurrency charts by TradingView.
Technical analysis tools by Coinigy.
Source: cryptopotato.com
View original post