
Ripple Price Follows Bitcoin, Getting Away From The Crucial $0.3 Benchmark: XRP Analysis & Overview
Ripple (XRP) saw a small price drop of approximately 1.6% over the past 24 hours, and it currently trades at $0.2739. This price fall comes after XRP rolled over at the $0.30 level and dropped by 6.5% over the past week as the cryptocurrency trends lower.
The drop in the value of XRP is mainly because of the recent $400 price decrease in Bitcoin over the past day. XRP remains the third-largest cryptocurrency with a market cap of $11.91 billion.
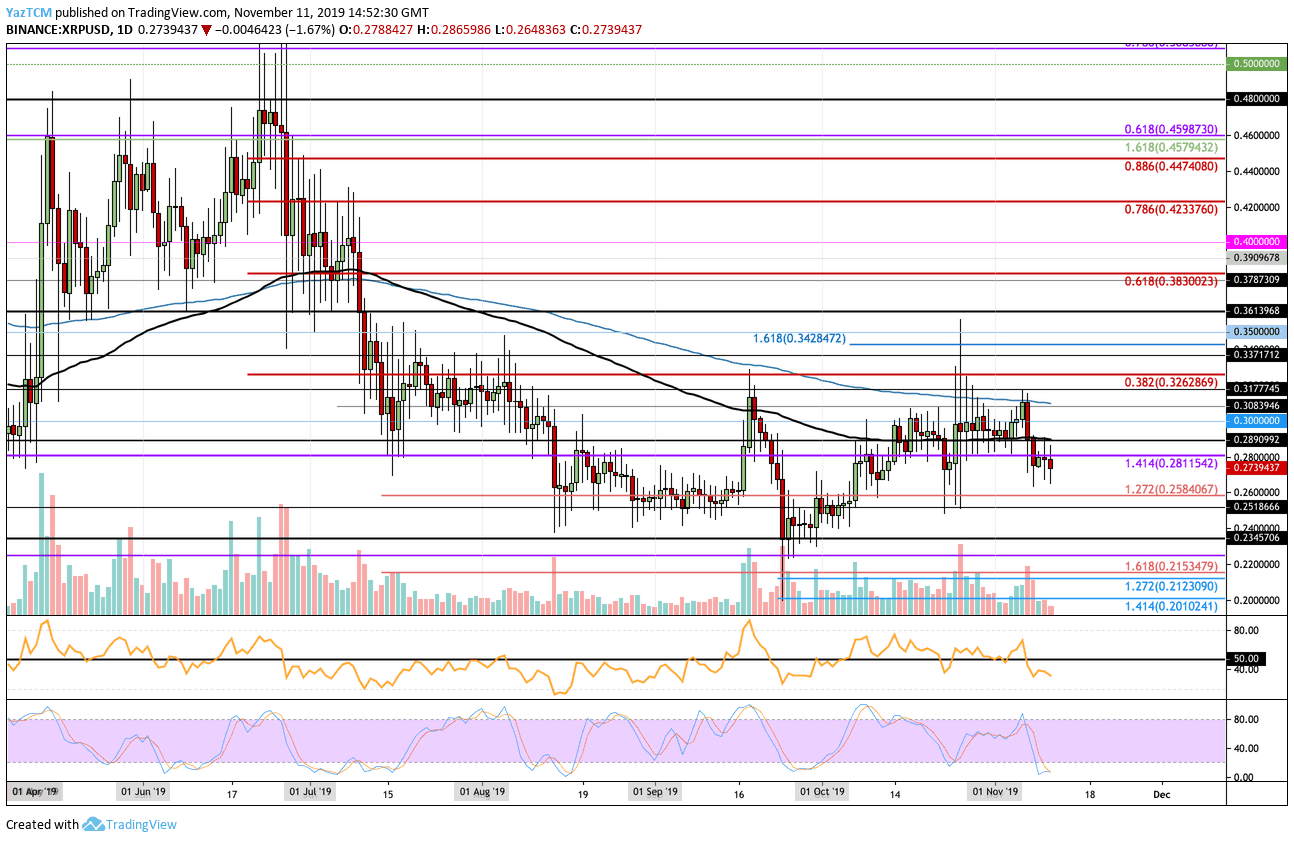
Looking at the XRP/USD 1-Day Chart:
- Since our previous XRP/USD analysis, XRP managed to break higher above the $0.30 level to reach the resistance at $0.3177, which is the 200-days EMA resistance. XRP was unable to break further above here, which caused the market to roll over and fall (also related to the Bitcoin price drop as mentioned above). XRP went on to drop beneath the 100-days EMA and continue to fall to the current price of $0.274.
- From above: The nearest level of resistance lies at $0.28. Above this, resistance lies at $0.2890 (100-days EMA), $0.30, $0.308 (200-days EMA), and $0.3177 (weekly high).
Further resistance can be found at $0.3262, $0.3371, $0.3428, and $0.35. - From below: The nearest level of support lies at $0.27. Beneath this, support lies at $0.265, $0.2584, $0.25, $0.24, and $0.2345.
- The trading volume remains around the average level of the past month.
- The RSI is well beneath the 50 level, which shows that the sellers are in control over the market momentum. However, the Stochastic RSI is trading in oversold conditions and is primed for a bullish crossover signal, which should send the market higher.
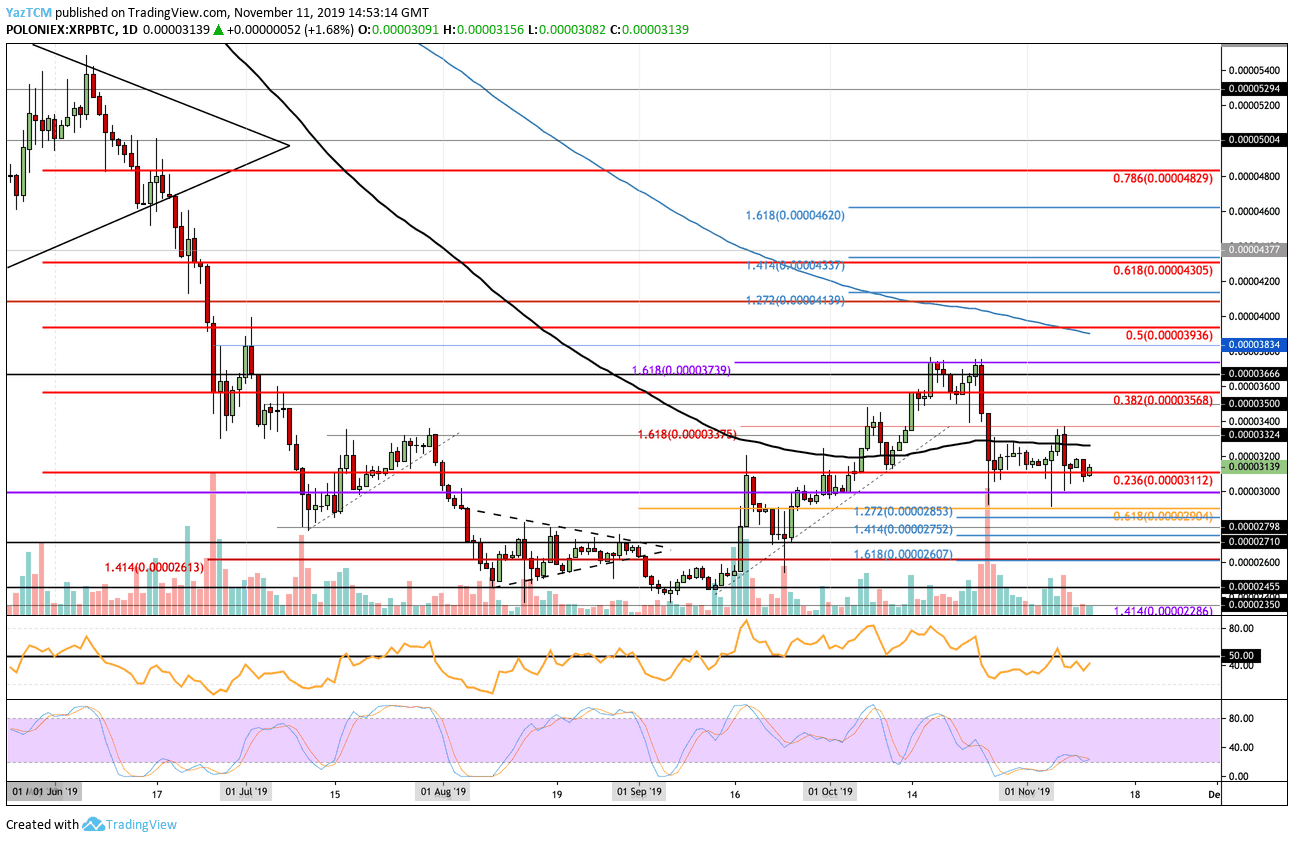
Looking at the XRP/BTC 1-Day Chart:
- Against Bitcoin, XRP was unable to make any ‘ground’ above the resistance at 3375 SAT, dropping toward the current trading level of 3140 SAT.
- From above: The nearest level of resistance lies at 3200 SAT. Above this, resistance lies at 3270 (100-days EMA), 3375 SAT, 3500 SAT, and 3568 SAT (bearish .382 Fib Retracement).
- From below: The nearest level of support lies at 3100 SAT. Beneath this, support lies at 3000 SAT, 2904 SAT (.618 Fib Ret), 2853 SAT, 2798 SAT, and 2752 SAT.
- The trading volume has been decreasing during the first half of November 2019.
- The Stochastic RSI is primed for a bullish crossover signal at the oversold territory, that might give birth to another mini bull run against Bitcoin.
Disclaimer: Information found on CryptoPotato is those of writers quoted. It does not represent the opinions of CryptoPotato on whether to buy, sell, or hold any investments. You are advised to conduct your own research before making any investment decisions. Use provided information at your own risk. See Disclaimer for more information.
Cryptocurrency charts by TradingView.
Technical analysis tools by Coinigy.
Source: cryptopotato.com
View original post