

With all the developments, ups and downs, crashes and rallies that the market has experienced over the course of the last year, it’s not surprising that there would be victims along the way. However, it’s interesting to notice that only 10 out of the top 50 coins by market capitalization are in green.
Indeed, the market has seen a number of things happening since this day last year, and it has reacted to most of it – not all, but most. There were sudden crashes and major jumps following each other, there were fake news, scams, lawsuits, regulatory distrust, more Faketoshi news, but also more adoption, partnerships, inability to ignore crypto, and development in the ecosystem. Yet, looking at the market now, only 24 coins from the top 100 are green in the past 12 months. From the top 50 coins by total market capitalization, only 10 have seen their prices appreciate. Out of those ten, only 3 are from the top 10 coins category. Importantly, the current results are still compared to the pre-crash period a year ago. If current prices do not change significantly in the first weeks of November, the yearly increase is going to be even larger.
Coins from the top 100 that appreciated in the past year
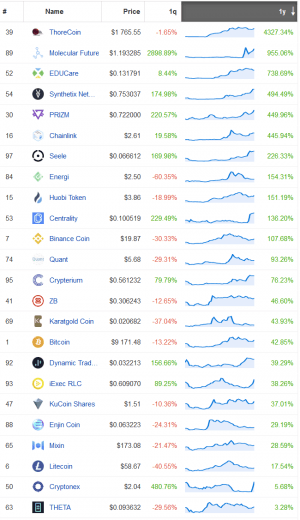
Now, let’s take a closer look at the 10 green coins from the top 50 and their respective changes since November last year.
ThoreCoin (THR)
The first coin on our list, and its definite winner, is THR which appreciated 4,327.34% in a year – substantially more than any other coin mentioned here. Its November 2018-March 2019 period saw a couple of significant fluctuations, particularly in December and January, during which its lowest price was USD 0.058 (which is also its lowest price in a year) and the highest USD 71. However, these are nothing compared to its jump in March, when the price not only started to, but continued to rise for four more months, reaching its highest price in the past year of USD 2,128 in June. It’s been a bumpy ride since, and the last quarter shows a large drop at the end of September, trading sideways afterwards until another drop on October 25th, when the price fell to USD 1,432. That said, the price appreciated 22.89% in the past 7 days and 1.85% in the past 24 hours, and is now trading at USD 1,765.
PRIZM (PZM)
It’s been a bumpy ride for PZM in the last year too, during which its price appreciated 449.96%. It saw a number of smaller rises and drops between November last year and early March this year, but despite the fluctuations, its trajectory was constantly upwards. It rallied again in mid-March, when it went from its November price of USD 0.05 to USD 0.41. That price fell and continued falling till May, had a smaller rally again at the end of May, though not reaching USD 0.41 level again, after which it fell and continued trading more-or-less sideways until August. It was gradually climbing again until the September rally, dropping afterwards, then rising in October. At the end of this month, it reached its highest price of the year, USD 0.72. It appreciated 48.73% in a week, and 15.95% in a day, and is now trading at USD 0.72.
Chainlink (LINK)
Now 16th by the total market capitalization, LINK appreciated 445.94% in the last year. Its November 2018-May 2019 was a relatively calm period, when its price was as low as USD 0.19, compared to its rise in June and a subsequent jump to USD 4.52 that month, which is its highest price in a year. It started falling afterwards, all the way to USD 1.53 in September, before jumping back to USD 3 level in October. It’s now changing hands at USD 2.61, having dropped 2.61% in a week and 0.33% since yesterday.
Huobi Token (HT)
HT’s price has seen a rise of 151.19% in the past year. Like previous coins, it started from the bottom and now it’s here – at the end of last year and the beginning of this, it was trading sideways, seeing its lowest price of USD 0.8. However, it started climbing already in February and, save for the fluctuations, it was rising gradually up until August, when it reached its highest price in a year, USD 5.35. It suffered a larger drop in August and another one in September, but it rose 19.8% since beginning of October. Additionally, it appreciated 21.99% in a week and 2.02% in a day, now trading at USD 3.86.
Binance Coin (BNB)
The first green one from the 10 leading coins, BNB saw a rise of 107.68% over the past year. Similarly as previous coins, the new year brought a lot of bullish good for BNB as its price chart shows a constant and gradual rise over several months, from its lowest point of USD 4.20 to its highest in a year of USD 39, reached at the end of June. However, it dropped afterwards, all the way to USD 14-15 level at late September / early October. It now trades at USD 19.87, having appreciated 22.91% in a month and 19.65% in the last seven days, but dropping 1.97% in the last day.
ZB (ZB)
The forty-second coin by market capitalization, ZB appreciated 46.60% in a year. Its price actually started at USD 0.2 in November, only to drop to its lowest in a year of USD 0.1 in December. Save for a few minor rallies, it exploded in March, when it got to its highest price this year of USD 0.44. Though the ride was bumpy since, having a couple larger drops in the last quarter, it didn’t return anywhere near its lowest point. It dropped 4.44% since October started, and 2.12% since yesterday, but rose 9.89% overall in the last week, making its current price USD 0.30.
Bitcoin (BTC)
In the 7th place, we find the world’s most popular coin, which saw a rise of 42.85% in the last 12 months. No coin’s price has been more closely observed every second of every day than BTC’s. The charts show us its price dropping in the November crash, from USD 6,000 level to USD 3,000 level. It hasn’t returned to that lowest point since. It saw a steady rise from February till May, followed by a number of rallies and crashes. It reached its highest price of the year in June, with USD 13,802. Since then, it was mostly trading at USD 9-10,000, save for the crashes in September and October. Since the beginning of October though, its price appreciated 8.98%. BTC’s current price is USD 9,171, having risen 22.67% in the past week, but dropping 1.72% since yesterday.
KuCoin Shares (KCS)
As many other coins, KCS saw a major drop last November, but after the crypto winter, it started to rise, and it appreciated 37.01% in the last 12 months overall. Its lowest price at the time was USD 0.3, but it jumped to its highest price in a year of USD 2.46 in April. And though it hasn’t reached that level since, it did rally again in June, August, September and October. Now changing hands at USD 1.51, KCS’s price appreciated 30.22% since October started, but also 35.61% in just the last week and 2.36% in a day.
Litecoin (LTC)
The final top 10 coin in the green since last November is LTC, which saw a rise of 17.54%. This popular coin, as the chart shows, has seen more and stronger fluctuations over the last 12 months. It rallied, but also dropped a number of times. Most significantly, while its lowest price for this time frame is USD 22.73 from the end of 2018, it reached its highest of USD 145 in the June rally. Its price has seen a steady drop from that level. Nonetheless, LTC appreciated 2.66% in the past month and 18.87% in the last seven days, though it dropped 2.76% since yesterday. Currently, it’s trading at USD 58.67.
Cryptonex (CNX)
We’re aptly ending this list with the 50th coin by market capitalization, which appreciated 5.68% in the last year. CNX’s charts are quite different from what we’ve seen with the other coins on this list. It fell in the crash from its highest price in a year of USD 2.48 to USD 0.8-1 levels that it maintained for a couple of months, then climbing to USD 1.3-1.5 levels afterwards, but all this time experiencing quite a few sharp jumps and drops. This type of volatility continues all the way till June, when its price dropped from USD 1.6 to its lowest price of the year, USD 0.21 in September. That said, it exploded on October 24th, seeing an astounding rise of 712.81% for the entire month, and of 596.86% in the past week. With the drop of 1.61% in the last 24 hours, CNX is now trading at USD 2.04.
It will be interesting to see if and how much more these price will change in November this year compared to its 2018 counterpart.
Source: cryptonews.com
View original post


