
Bitcoin Just Broke To The Bullish Side: Is $10,000 The Next Target? Bitcoin (BTC) Price Analysis
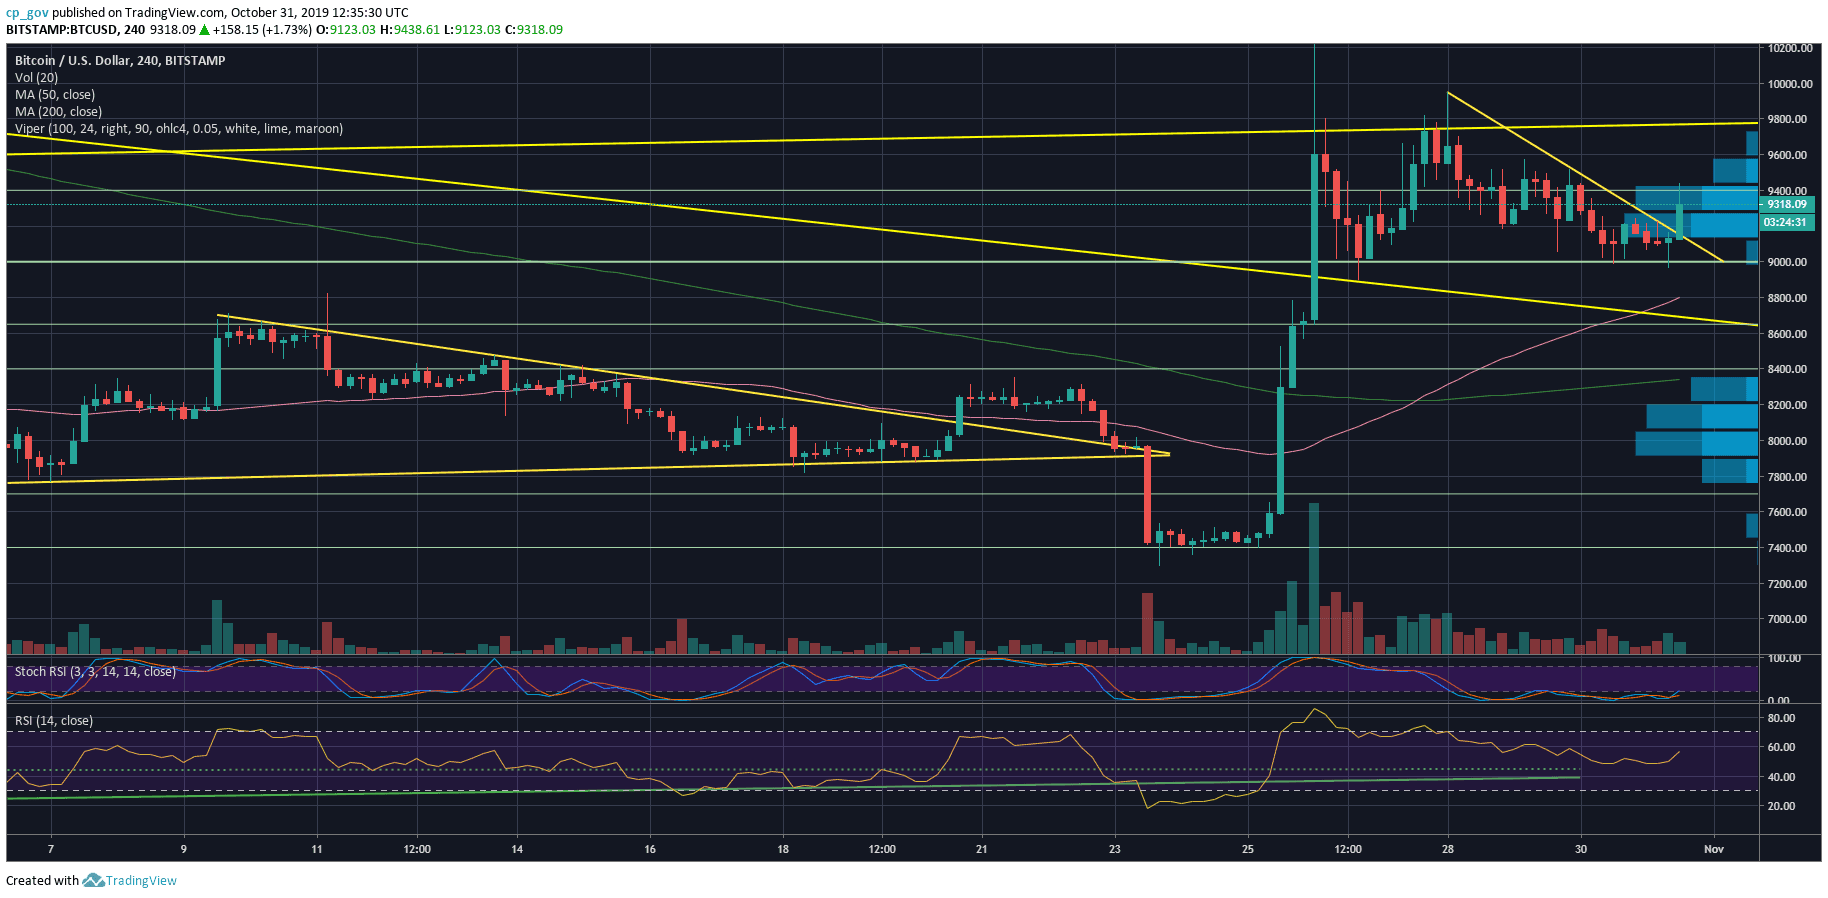
Since reaching $9,950 three days ago, Bitcoin was forming a dangerous bearish triangle on the 4-hour chart, as could be seen on the following 4-hour’s.
Bearish triangles usually tend to break to the downside. However, Bitcoin just broke above, followed by a massive $500 surge (as of writing these lines) from the current daily bottom around $8,950 (Bistamp).
Once again, the majority proved to be wrong, following the recent bearish sentiment among the crypto traders. As of now, Bitcoin looks healthy after invalidating the bearish triangle pattern as well as closing the CME Futures’ open gap at the $8900 level.
Total Market Cap: $248.4 billion
Bitcoin Market Cap: $168.4 billion
BTC Dominance Index: 67.7%
*Data by CoinGecko
Key Levels to Watch
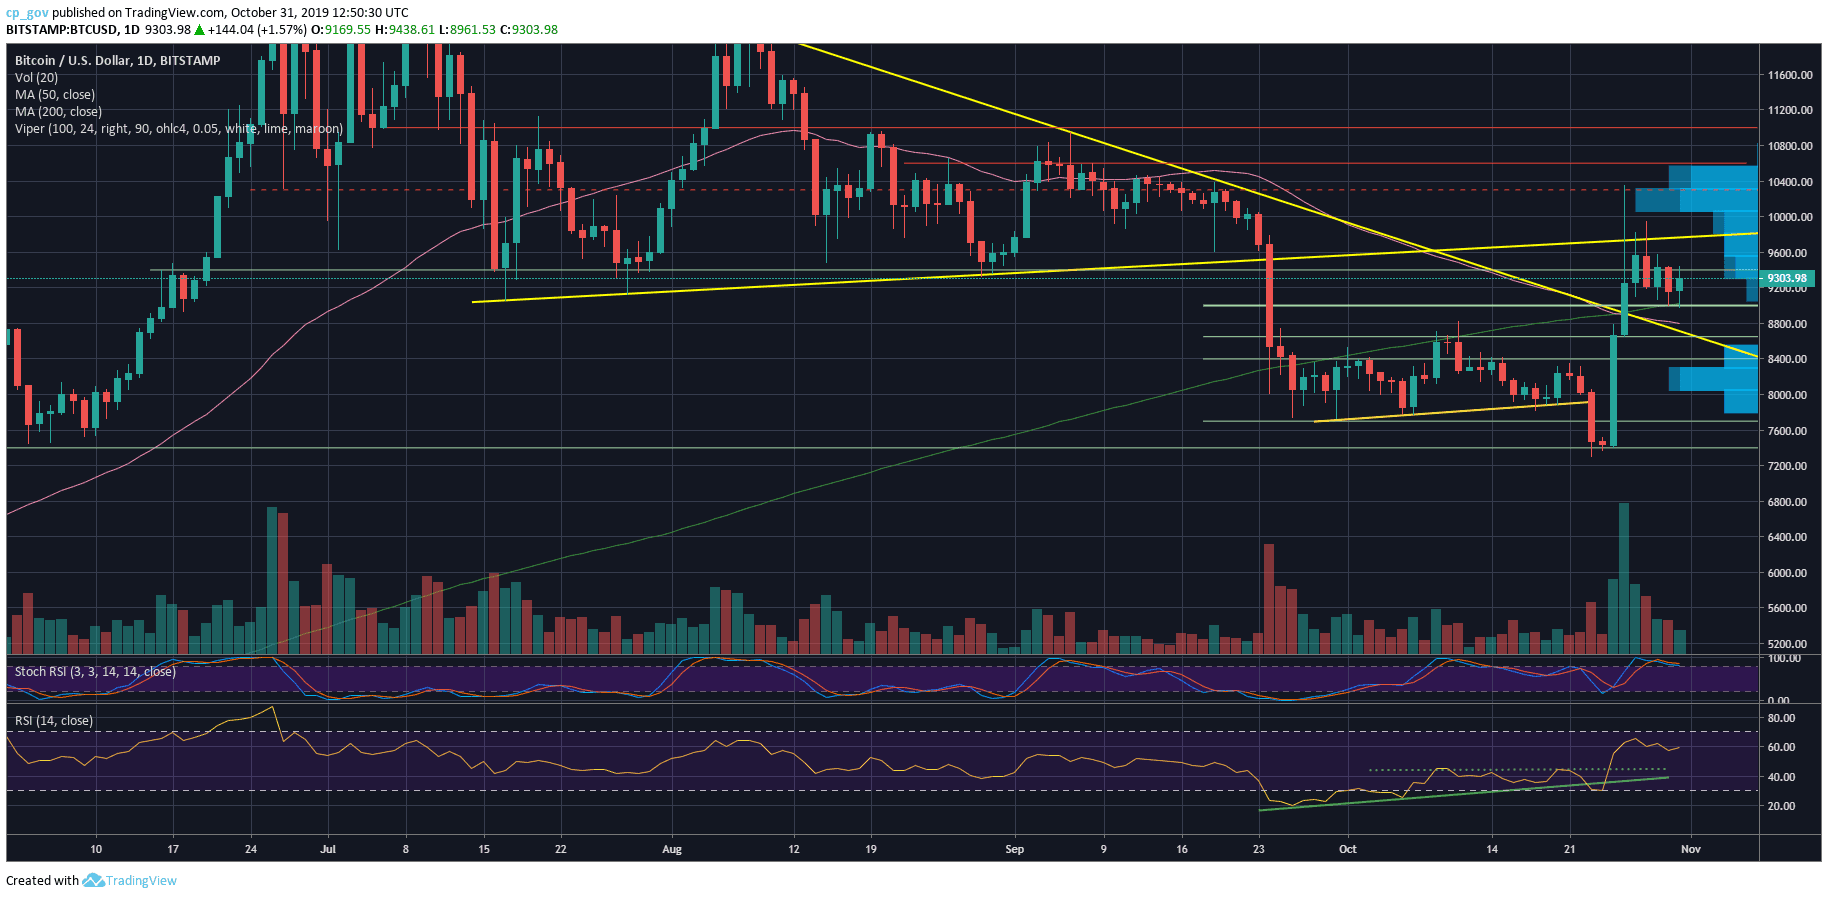
– Support/Resistance: As of writing this update, the current daily high lies around $9,440, which is a substantial previous resistance area. This area is the 2019 mini-triangle’s lower boundary from the past month of September.
In case of a break-up, Bitcoin next serious resistance area along with demand (as can be seen on the chart by the VPVR – attached to the right side), is the $10,000 level (weak resistance is expected at $9500 – $9600 and $9800). Further above lies $10,300 – $10,400 (Saturday’s high). Higher targets are $10,600 and $11,000 (significant resistance).
From below, the first level of support is the good old $9200, along with the breakout area. Further below is the $8900 – $9000, including strong resistance (which held the current price level nicely). The next level of possible support is the Golden Fibonacci, 61.8%, roughly around $8500, followed by $8400.
– The RSI Indicator (Daily): Since the last week’s huge price surge (42% daily surge last Saturday), the RSI is showing a bit of bearishness, producing a series of lower lows. It will be interesting to see if the current support level of 55-56 can hold the indicator bullish.
Stochastic RSI also tends to the bearish side, following a cross-over in the overbought territory. However, the oscillator hadn’t yet entered the bearish territory.
– The Trading Volume: Since Saturday, the volume is declining, anticipating the next move. The volume is still above the average level of the past month.
BTC/USD BitStamp 4-Hour Chart
BTC/USD BitStamp 1-Day Chart
The views and opinions expressed above are solely those of the author and do not reflect those of CryptoPotato. You should conduct your own research before making any decision. Every investment involves serious risk.
Cryptocurrency charts by TradingView.
Technical analysis tools by Coinigy.
Source: cryptopotato.com
View original post


