Bitcoin Price Analysis: Following Consolidation, Is BTC Ready For Another Huge Price Move?
Following its highest daily price increase since 2011 three days ago, Bitcoin made some retracement to the $8,900 price area, before forming another healthy higher low, as of yesterday.
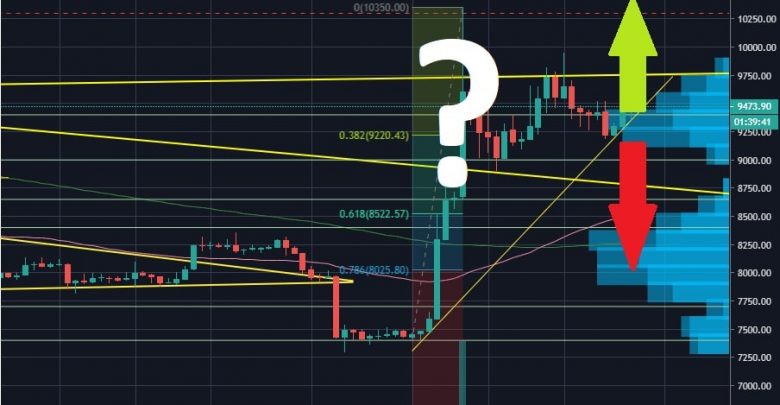
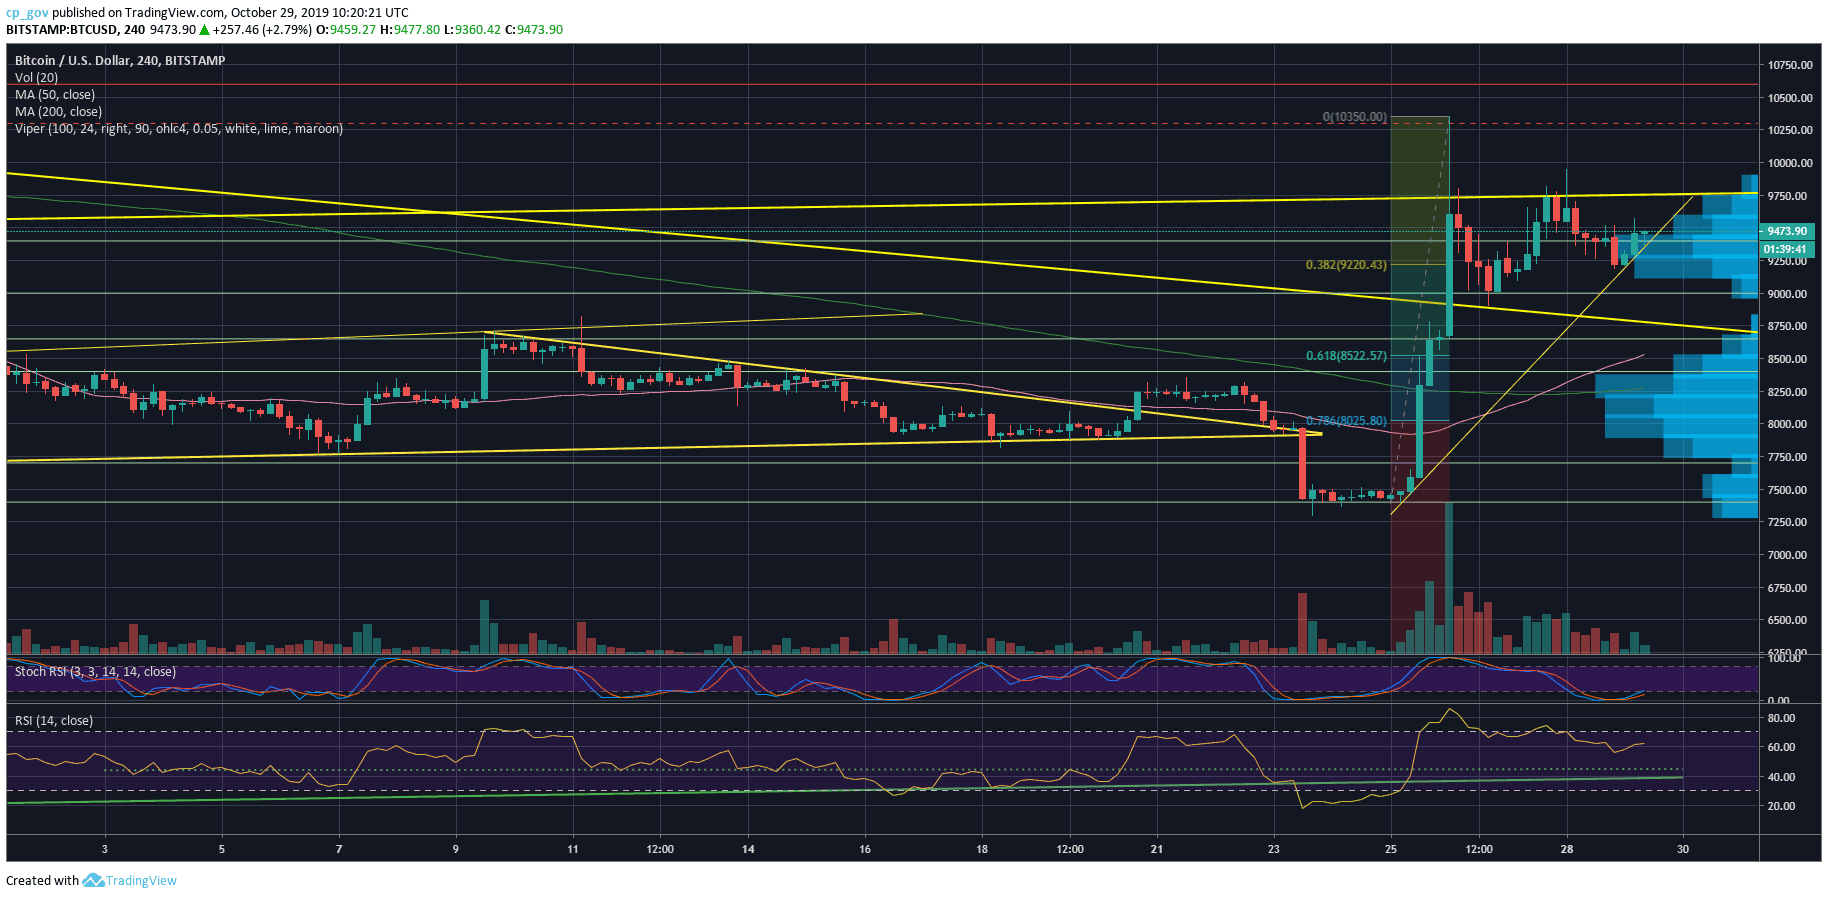
Looking on the attached 4-hour chart, Bitcoin is ‘locked’ between three trend lines, in what looks like final preparations for another huge move.
Overall, Bitcoin looks bullish, forming higher-lows trajectory, as can be seen on the 4-hour chart. Added to the above, Bitcoin is trading above the significant 200-days moving average line (roughly around $9,000).
A little short-term bearish thing to keep in mind is the open price gap at $8,900 on the CME Futures’ chart. Another thing is the Death Cross, which recently took place. As been said here before, the Death Cross is usually coming in some delay to the current price pattern. Following the latest price spike, it’s very reasonable that this cross would turn to be a fake-out (like happened in late 2015).
Total Market Cap: $250.8 billion
Bitcoin Market Cap: $169.7 billion
BTC Dominance Index: 67.6%
*Data by CoinGecko
Key Levels to Watch
– Support/Resistance: After forming a decent higher-low around the strong support area of $9200 (which is the 38.2% Fibonacci retracement level), Bitcoin is consolidating amid the $9400 resistance zone. This area is full of confluence, due to the past price action (the 2019 mini-triangle lower boundary from September).
From above, in case that $9400 will get broken above, the ascending trend-line at $9750 along with $9800 resistance is the next target. Further above is $10,000 and $10,300 – $10,400 (Saturday’s high). Higher targets are $10,600 and $11,000 (significant resistance).
From below, the first level of support is the mentioned $9200. Further below is the $8900 – $9000, including strong resistance turned support and the CME price gap. The next level of possible support is the Golden Fibonacci, 61.8%, roughly around $8500, followed by $8400.
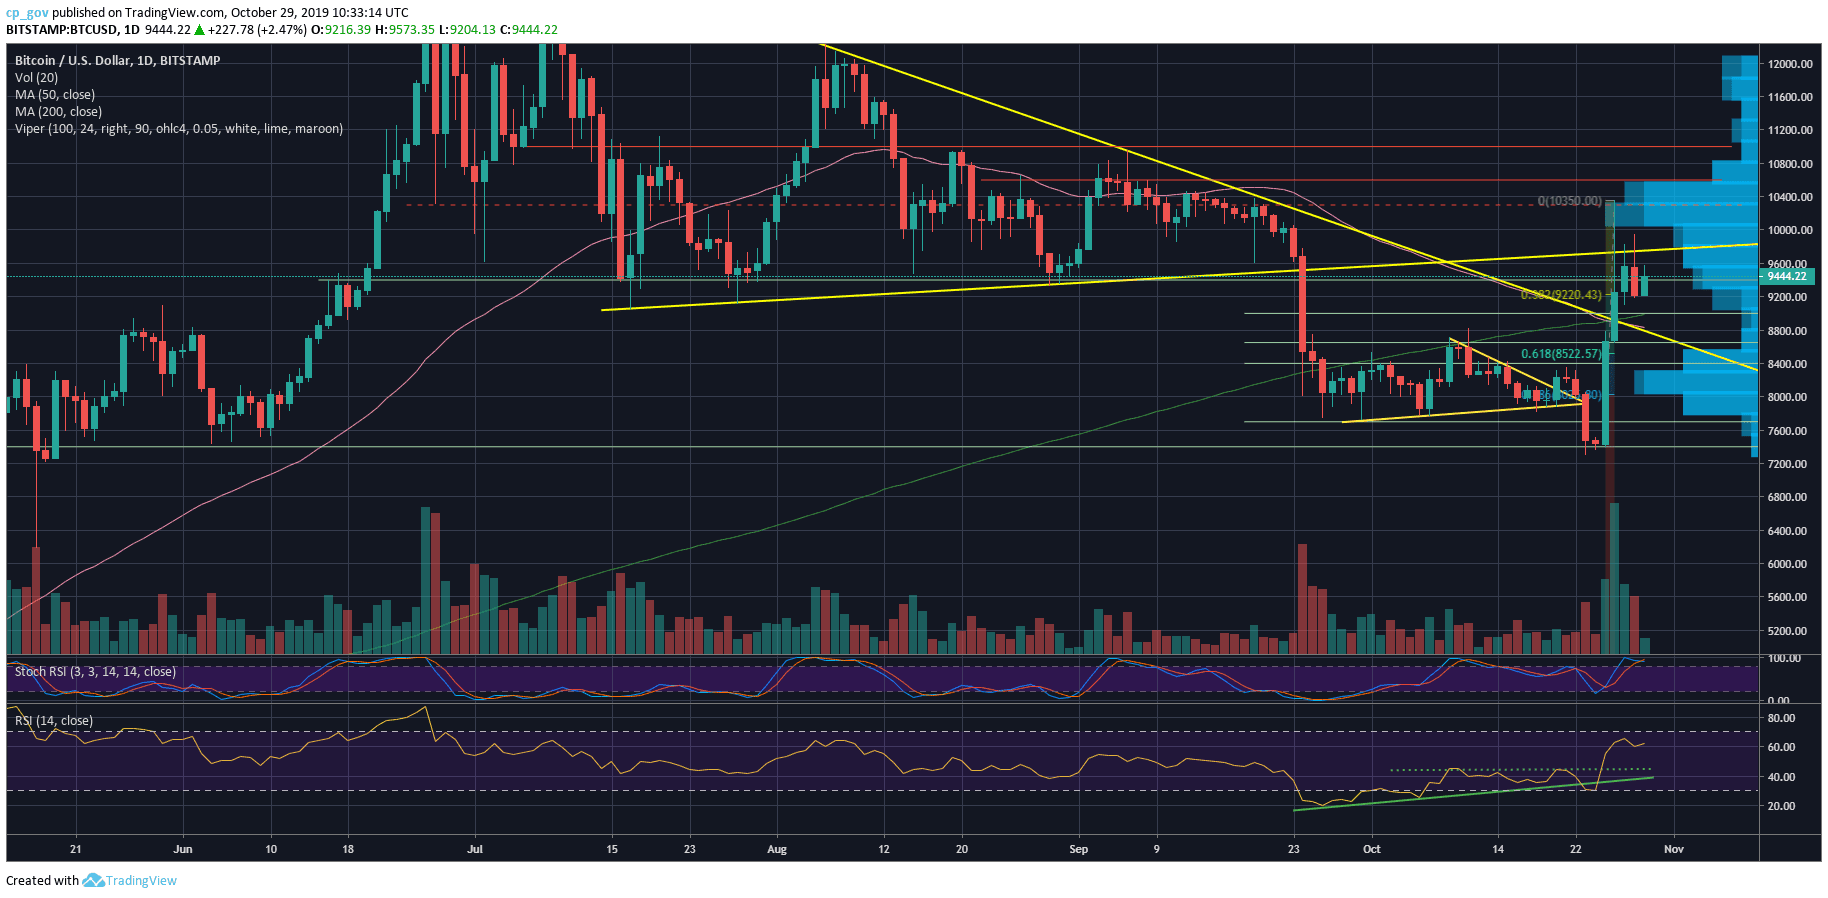
– The RSI Indicator (Daily): The RSI looking bullish, following a surge to 66 and a healthy retracement to 60. The price surge caught the RSI at its final line of support (the 30 levels), after the price move, the RSI is looking bullish above the 60 levels.
– The Trading Volume: Following the colossal volume candle, which was the highest volume day since June 27, the volume had declined over the following two trading days. In anticipation of the next big move.
BTC/USD BitStamp 4-Hour Chart
BTC/USD BitStamp 1-Day Chart
The views and opinions expressed above are solely those of the author and do not reflect those of CryptoPotato. You should conduct your own research before making any decision. Every investment involves serious risk.
Cryptocurrency charts by TradingView.
Technical analysis tools by Coinigy.
Source: cryptopotato.com
View original post


