
Bitcoin Price Analysis: Death Cross To Ruin The Party? Is BTC Headed Toward $16,000 October Prediction?
After a weekend full of price action, there is no doubt that the Bulls got their control of the market once again.
The recent week saw Bitcoin breaking down a mid-term triangle (can be seen on the following charts), producing a massive move to the downside, and finding support on a level that had seen by many as critical support. That was the 61.8% Golden Fibonacci, around the $7200 area.
Bitcoin didn’t consolidate for much time, until a huge candle cleared the supply and sent Bitcoin all the way to the significant resistance of $8800 – $9000 which contains the 200-days moving average line, along with the descending line started forming since Bitcoin reached its high of 2019 (June 26, the middle-marked yellow line).
Confirming Past Resistance As Support
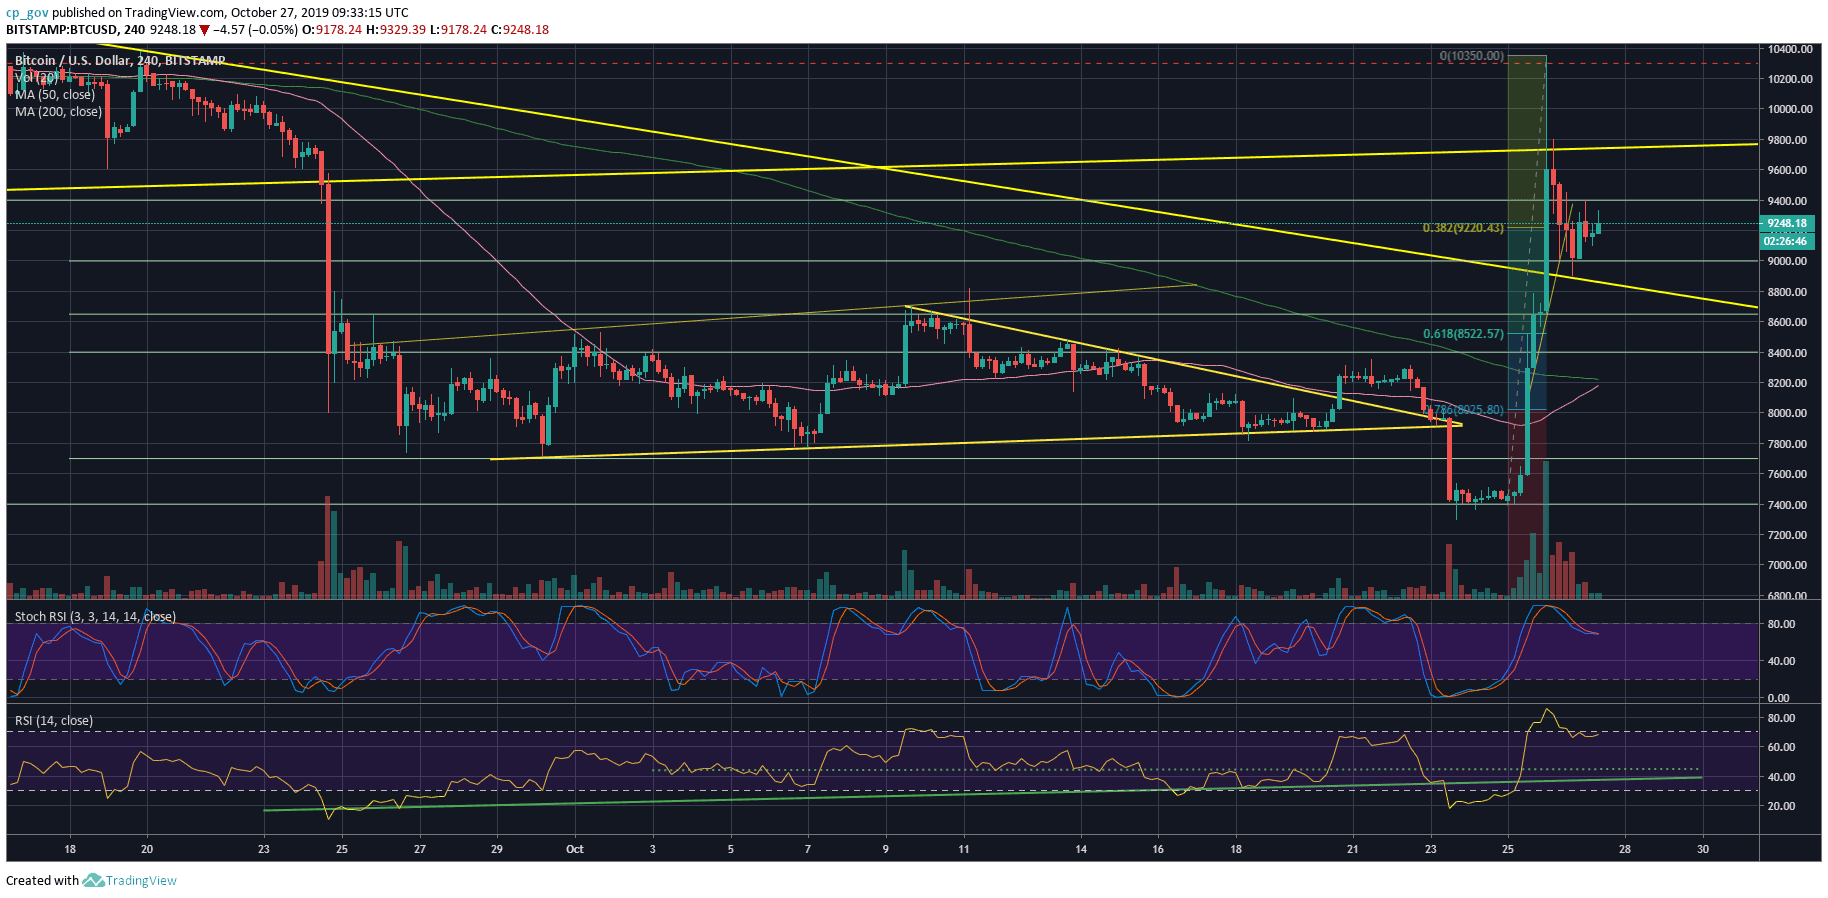
As can be seen on the 4-hour chart, since breaking above it, we saw another stunning wave up. Excluding its respectable candle wick (that reached $10,350 on Bitstamp), the candle body reached the ascending trend-line of the “2019 Triangle” formation we had mentioned here during the past months (the line is the upper-marked yellow line).
The volatility continues. Strong resistance becomes strong support, and this is exactly what Bitcoin had done — going down roughly $800 from the upper line to the middle line to confirm it as support. Since then, we saw Bitcoin gaining momentum again. Over the past hours, Bitcoin is consolidating around the $9200 price area (which is the 38.2% Fibonacci retracement level from the vast price move).
The Bulls And The Death Cross
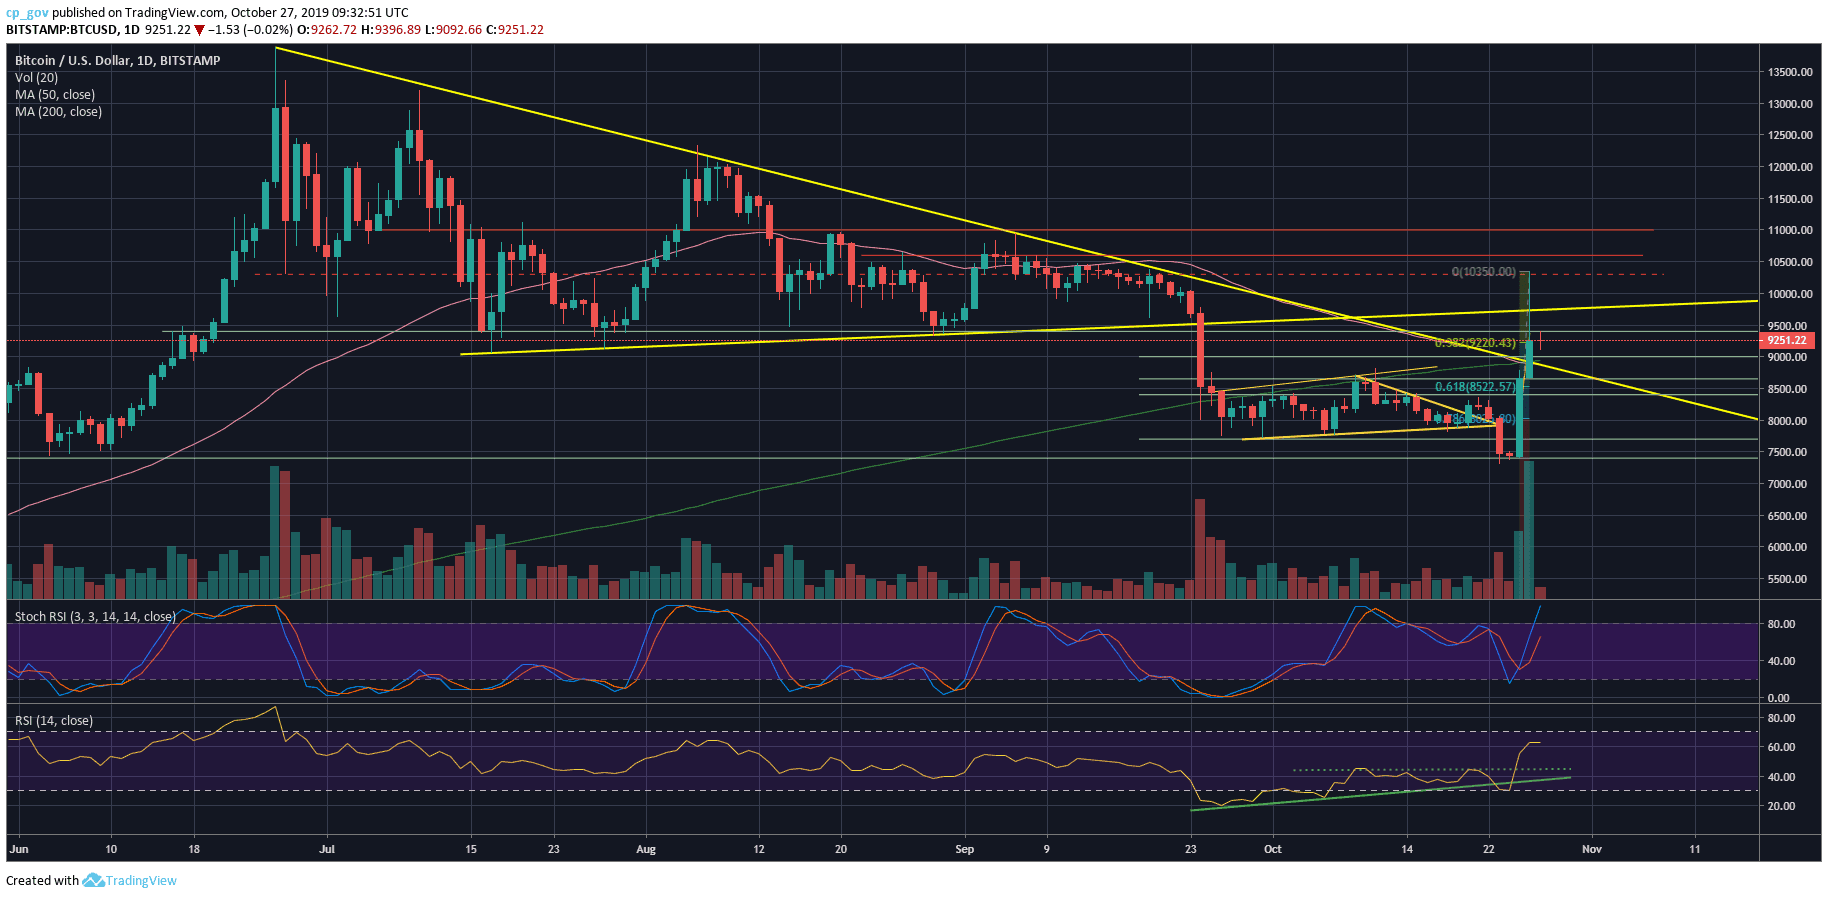
The Bullish news: The huge move shook all the bears, liquidated millions of Bitcoins from the short positions and placed Bitcoin on a great spot to continue further above: On top the significant 200-days moving average line (marked light green on the daily chart) as well as on top of the crucial descending trend-line (the middle yellow line).
However, if the bulls would like to maintain this, they should keep the price above that double resistance (descending trend-line, along with the MA-200).
Another thing to watch is the Death Cross that just took place. This cross is usually telling about a coming-up bear market. However, the cross (of the MA-50 below the MA-200) is lagging; hence, it didn’t consider the weekend’s price action. It depends solely on Bitcoin, but the short days might push Bitcoin higher and thus the MA-50 back beyond the MA-200 (which is called a Golden Cross).
History tells us that there was a Death Cross during 2015 (September 12), which had turned to be a fake-out and, after not so long (October 26, 2015), produced a Golden Cross. Needless to say, following that Golden Cross, Bitcoin officially started the 2016 – 2017 famous Bull market.
CME Gap – A New One?
Regardless, as stated here before, price gaps tend to get filled. The last time the CME Futures were trading was around $8800. It will be interesting to see whether this gap will get closed soon. For Bitcoin, it might be better to “go there now” and clear off that doubt to the CME.
Total Market Cap: $204.2 billion
Bitcoin Market Cap: $134.7 billion
BTC Dominance Index: 66.0%
*Data by CoinGecko
Key Levels to Watch
– Support/Resistance: As mentioned above, Bitcoin is consolidating around the $9200 mark (which is the 38.2% Fibonacci retracement level). The next level of resistance is today’s high along with resistance at $9400.
Further above lies the $9800, along with the ascending trend-line (the upper yellow line), the $10,000 mark, before reaching to $10,300 – $10,400 (Saturday’s high). Higher targets are $10,600 and $11,000 (significant resistance).
In Bitcoin, anything is possible, and following the 42% daily increase, there are speculations whether the anonymous predictor, which could possibly know something that we don’t, will reach his October 2019 prediction at $16,000. As of now, he has less than four days to go.
Some support areas: The first level of support is the current area of $9200. Below lies the $9000 area, which contains the 200-days moving average line ($8940 as of now). Further below is the $8800 (the CME futures gap). The next level of possible support is the Golden Fibonacci level, 61.8%, roughly around $8500, followed by $8400.
– The RSI Indicator (Daily): The price surge caught the RSI at its final line of support (the 30 levels), after the price move, the RSI is looking bullish above the 60 levels.
– The Trading Volume: Finally, some neat and green volume of buyers. Yesterday was the highest volume day since June 27. Just as a friendly reminder, Bitcoin reached its 2019 high on June 26. Another bullish sign.
BTC/USD BitStamp 4-Hour Chart
BTC/USD BitStamp 1-Day Chart
The views and opinions expressed above are solely those of the author and do not reflect those of CryptoPotato. You should conduct your own research before making any decision. Every investment involves serious risk.
Cryptocurrency charts by TradingView.
Technical analysis tools by Coinigy.
Source: cryptopotato.com
View original post


