
Crypto Winter Is Here: Those Are The Next Possible Targets For Bitcoin Price (Analysis & Overview)
Following yesterday’s analysis, just a matter of hours, Bitcoin couldn’t hold, and the results were devastating.
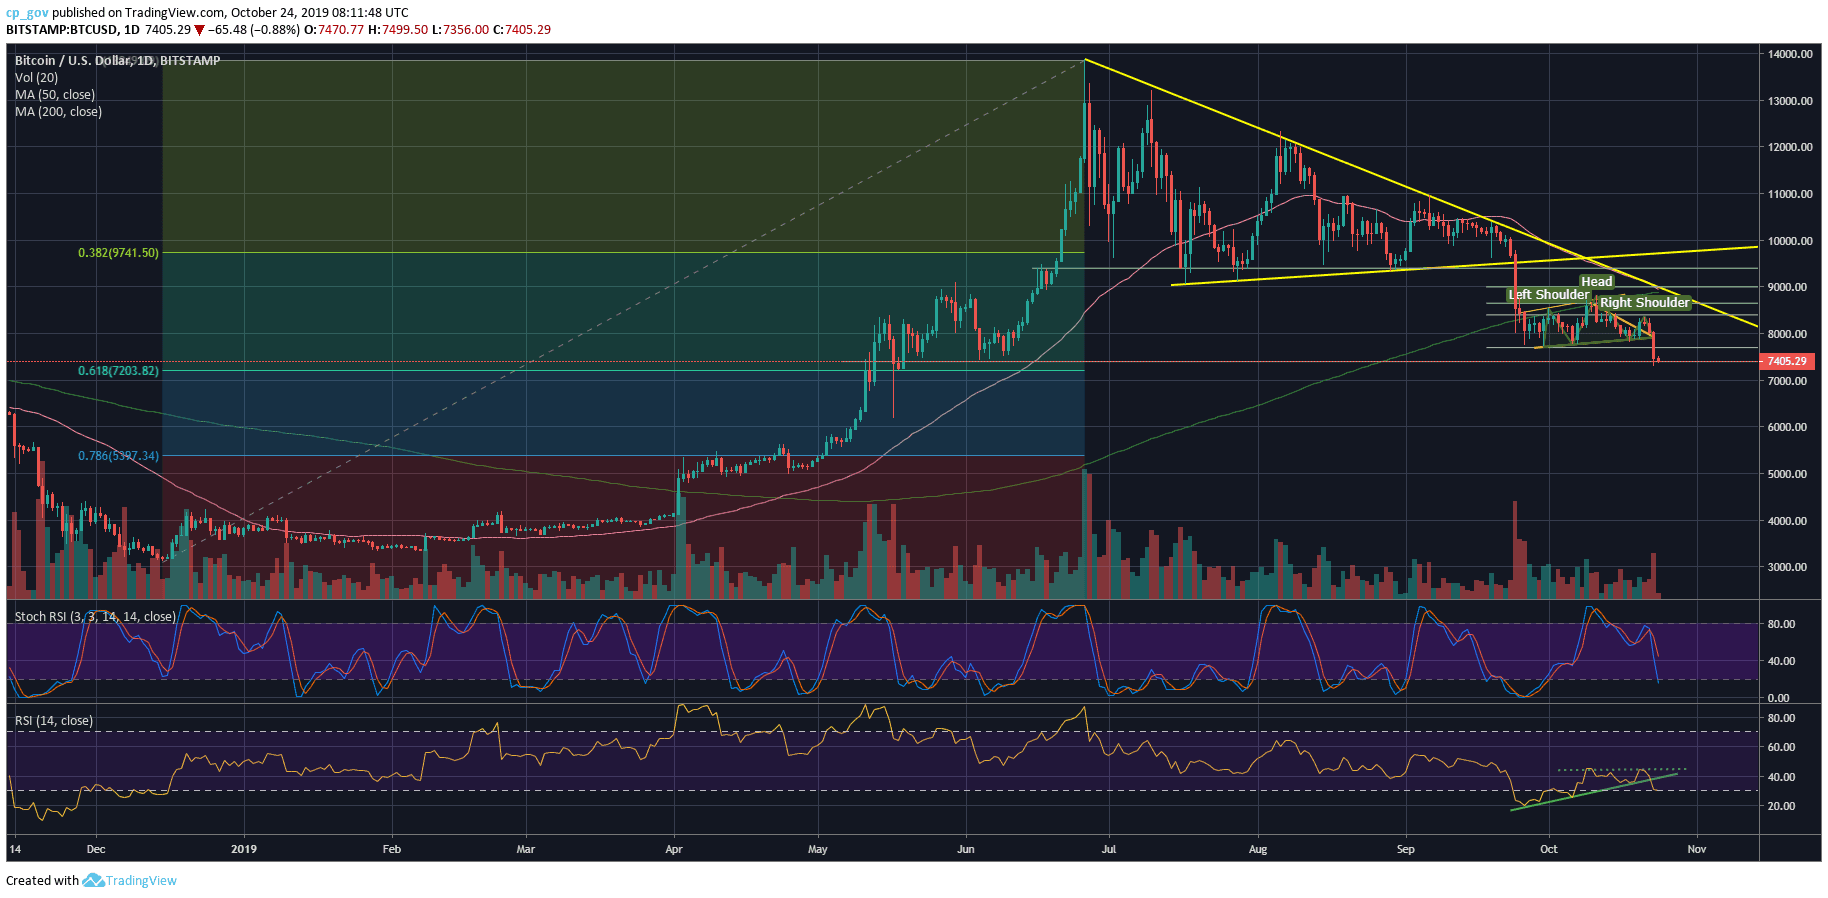
After trading sideways for almost a month, Bitcoin broke down the ‘neckline’ of the Head and Shoulders pattern that was identified here yesterday, followed by a huge red candle of more than $600. As of writing this, the low of the past 24 hours lies at $7300 (BitStamp). Bitcoin had lost $10,000,000,000 from its market cap since yesterday.
Technical analysis is, for sure, not science. If it was so, all traders were millionaires. However, sometimes the signs were actually there: The Bitcoin price chart had expected a massive move throughout the recent days, while yesterday, the direction had become clear.
As time goes by, the year to date 2019’s Bitcoin chart seems more and more like a mini-market cycle. If this is the case, then unfortunate to the bulls – we hadn’t seen the bottom yet.
Needless to say, the huge drop from yesterday was followed by a massive amount of volume. This was the highest volume day recorded since September 26, 2019.
Bitcoin Price: What’s Next?
Looking at the broader picture, as can be seen on the following daily chart: After breaking down the critical support line mentioned here yesterday, the H&S pattern had played out and handed a possible target (high probability) at around $6900 – $7000.
Before the last, Bitcoin might find some support at $7300 (weak), while the $7200 should provide more support, as the Golden Fibonacci level (61.8%) from the 2019 bull-run.
Below $6900, Bitcoin’s next level of confidence is the $6000 – $6200 region. Whoever suffered at the 2018 bear market might recognize how that level kept Bitcoin price throughout the year of 2018, until the horrible day of November 14, 2018, when Bitcoin sharply broke down the $6K area in its way to the 2018 low of $3,120.
Further below is $5400, which is a strong support level, along with the 78.6% Fibonacci retracement level.
And some optimism to end this analysis: Bitcoin still maintains almost 100% return on investment since 2019 begun. This is more than any other investment instrument around.
Total Market Cap: $204.2 billion
Bitcoin Market Cap: $134.7 billion
BTC Dominance Index: 66.0%
*Data by CoinGecko
BTC/USD BitStamp 1-Day Chart
The views and opinions expressed above are solely those of the author and do not reflect those of CryptoPotato. You should conduct your own research before making any decision. Every investment involves serious risk.
Cryptocurrency charts by TradingView.
Technical analysis tools by Coinigy.
Source: cryptopotato.com
View original post


