
Bitcoin Price Analysis: BTC Steady But Scary – Anticipating a Huge Price Move
Bitcoin price over the past days isn’t the best show in town. The cryptocurrency had been boring, trading under a tight range above and below the $8000 mark. As of now, the coin’s price is around the same levels of three days ago.
A couple of signs are suggesting a vast move coming up: Bitcoin is coming to a decision point on the horizontal triangle being built in the mid-term.
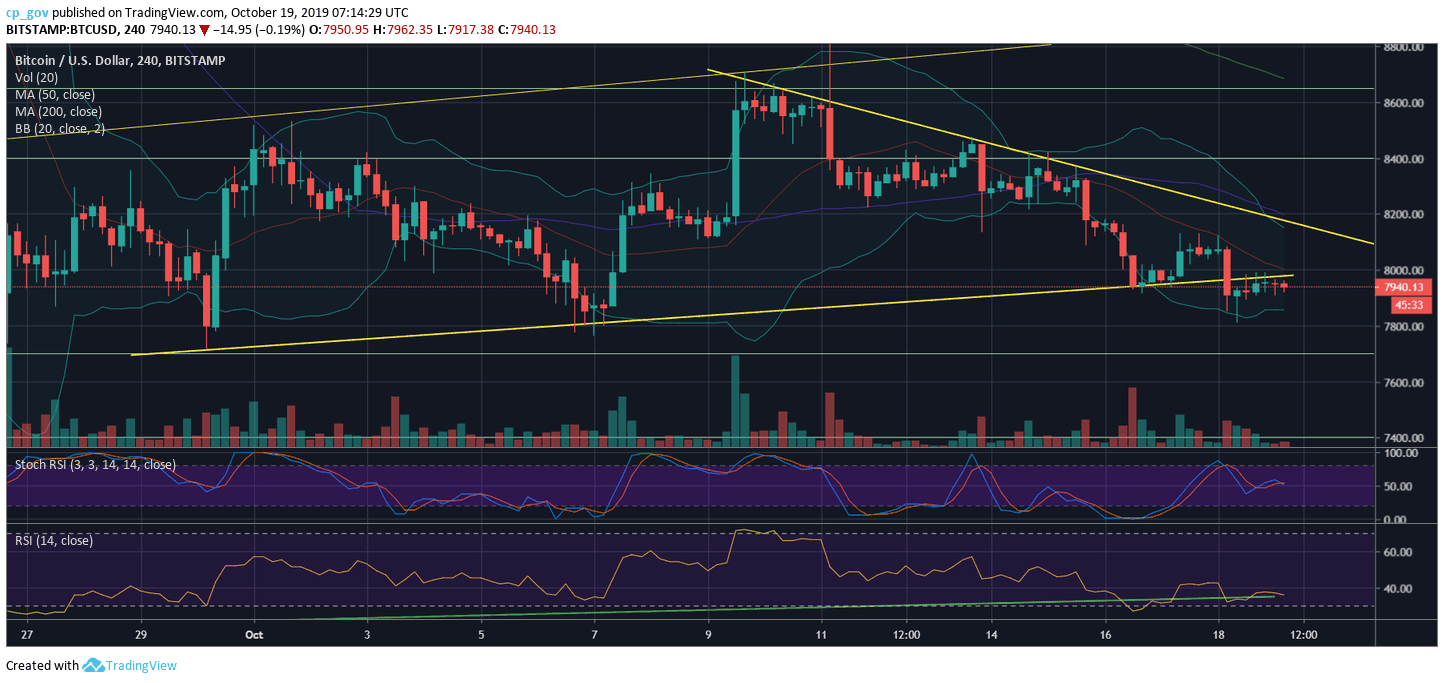
Bitcoin is forming a short-term triangle (can be seen on the following charts), where its apex takes place in the next 24-48 hours. Besides, The RSI indicator is reaching its ascending support trend-line along with the 36-resistance turned support level. Added to it, Bollinger bands are in their tight stage, along with the minor amount of trading volume, which had been continually declining since September 24.
Unlike the crypto community on twitter, suggesting Bitcoin to $6K, in my opinion, the direction isn’t clear yet. So far, Bitcoin proved that it acts against the majority’s thoughts. The coming day or two is critical, and we will get the answer.
Total Market Cap: $217 billion
Bitcoin Market Cap: $143.4 billion
BTC Dominance Index: 66.1% (Since its 2-year high at 72% a month ago, the altcoins are getting stronger)
*Data by CoinGecko
Key Levels to Watch
– Support/Resistance: Over the past days, Bitcoin had been following a short-term ascending trend-line (shown on the following 4-hour chart). As we can see, after breaking down from it, the line is still following the price; however, as resistance. The bulls would love to see Bitcoin breaking up from the triangle mentioned, roughly around $8100 – $8200 (along with the 4-hour MA-50 – marked in dark blue line).
In that case, the next resistance levels would be $8400, $8600, and the crucial $8800 (which contains the 200-days moving average line).
From the likely direction of the bearish side, the next support level is the $7700 – $7800 area, which is the lowest since June 2019. If Bitcoin breaks down, we can expect to see $7500 very quickly (a breakdown is expected to carry a strong move since the support area had been holding three times so far). From below, there is the significant level of $7200, which is the Golden Fibonacci level (61.8%) since the all-time high.
– The RSI Indicator (Daily): The indicator is maybe the sole positive light, as the higher lows trajectory so far being kept alive. However, as mentioned above, the RSI is now facing the higher lows pattern encountering the line as a crucial decision point.
– The Trading Volume: As discussed, many times before, the traders are off for now. We hadn’t seen a significant amount of volume since September 26.
BTC/USD BitStamp 4-Hour Chart
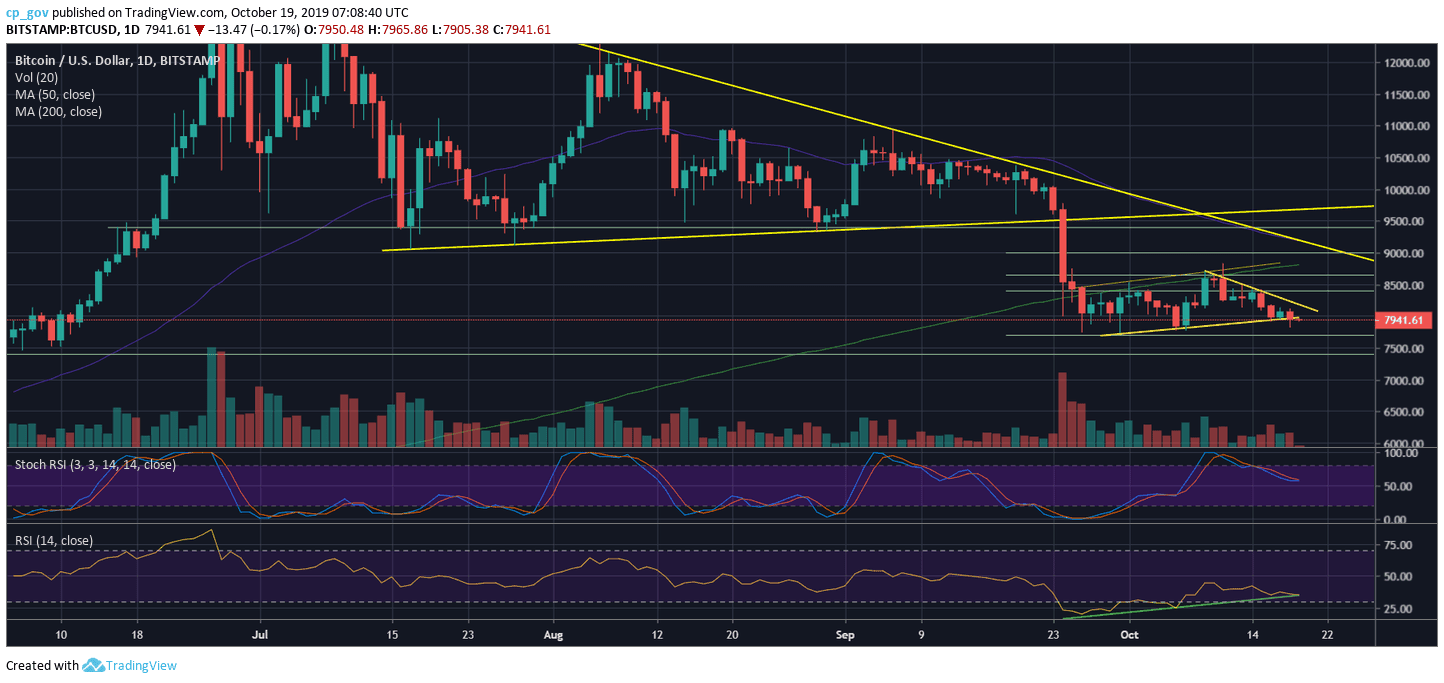
BTC/USD BitStamp 1-Day Chart
Source: cryptopotato.com
View original post


