
Etherium Price AnalysisPrice Analysis
Ethereum Price Analysis: ETH Falls Below $180, More Pressure Ahead?
Ethereum saw a small decline of around 3.26% over the past 24 hours and it currently trades at $178. ETH has seen a further 10% drop over the past month. The cryptocurrency recently met resistance at the 100-days EMA and failed to break above it which caused ETH to roll over and fall.
Ethereum remains the second-largest cryptocurrency with a market cap of $19.32 billion.
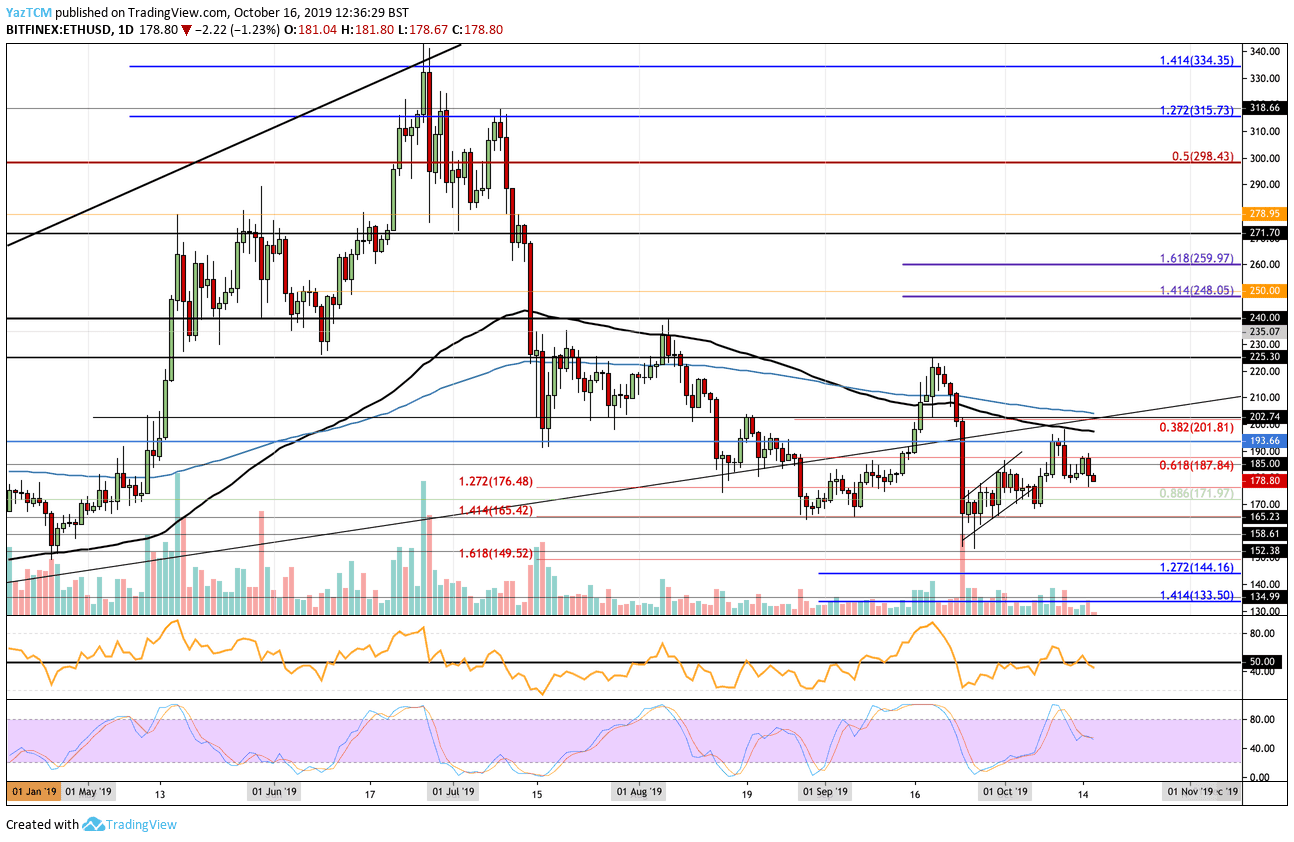
Looking at the ETH/USD 1-day chart:
- Since our previous ETH/USD analysis, the cryptocurrency continued to fall after meeting the resistance at the 100-days EMA. ETH failed to close above resistance at $193.66 and proceeded to fall further beneath $180.
- From above: The nearest level of resistance lies at $185 and $187.84. Above this, resistance is located at $190, $193.66, and then at the 100-days EMA. If the bulls can penetrate above the 100-days EMA, resistance is expected at $200 and $202 (200-days EMA).
- From below: The nearest level of support lies at $178.80. Beneath this, support lies at $171.97, $165.23 (September low-day close), $160, $158.61, and $152.38.
- The trading volume has been diminishing during October and remains relatively low.
- In our last analysis, the Stocahstic RSI had produced a bearish crossover signal which led to the recent price fall. The RSI has recently slipped beneath the 50 level which shows that the sellers are starting to take control over the market momentum.
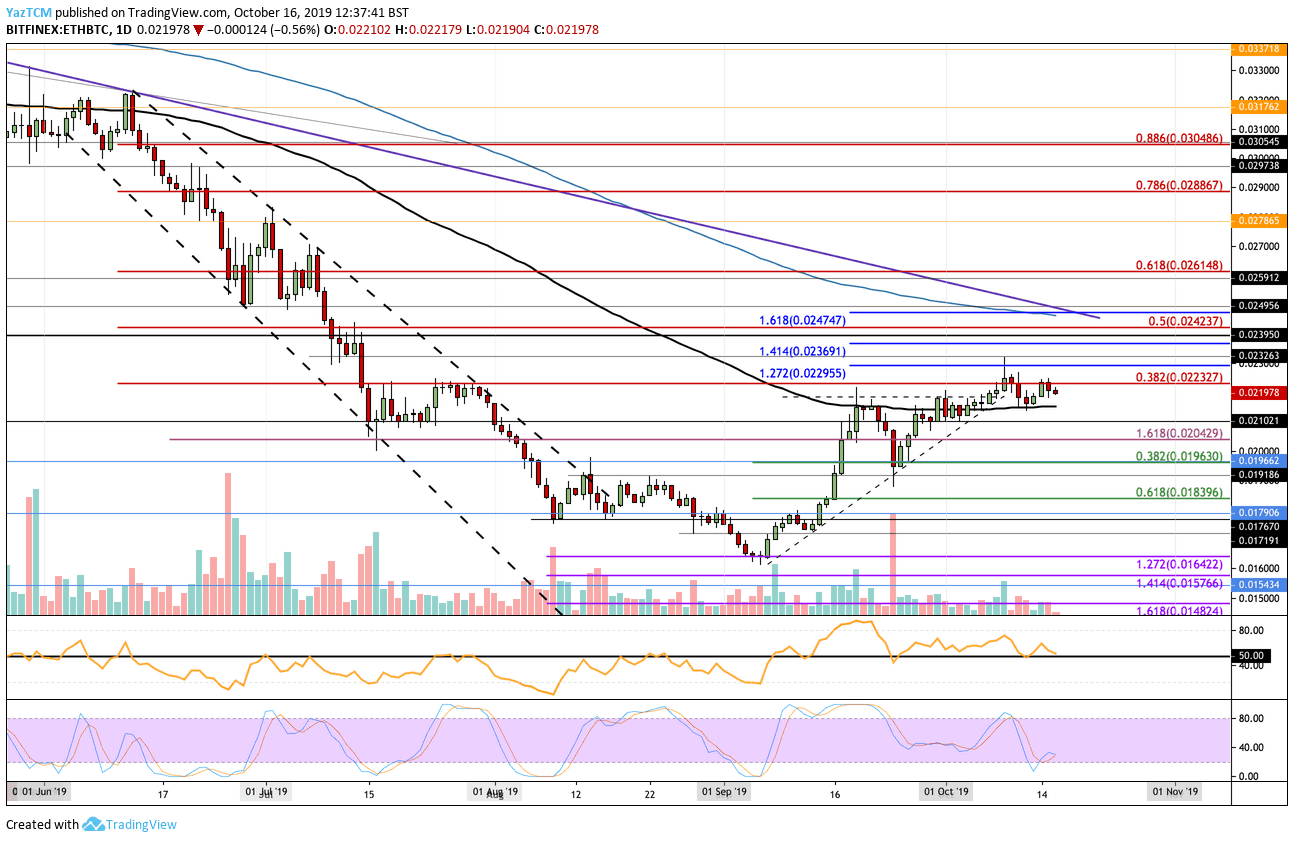
Looking at the ETH/BTC 1-day chart:
- Against BTC, ETH has remained fairly stagnant. The cryptocurrency failed to make any movement above the resistance at 0.02232 BTC but managed to remain above the 100-days EMA at 0.02155 BTC.
- From above: The nearest level of resistance lies at 0.02232 BTC. Above this, resistance is expected at 0.02295 BTC, 0.02363 BTC, 0.02368 BTC, 0.02423 BTC, and 0.02474 BTC (200-days EMA).
- From below: The nearest level of support lies at the 100-days EMA. Beneath this, support can be found at 0.021 BTC, 0.0204 BTC, 0.022 BTC, 0.01963 BTC, and 0.01840 BTC.
- The trading volume is also diminishing within this market.
- The RSI is currently battling the 50 level as the bulls fight to remain in charge of the market momentum. The Stochastic RSI looks promising for the bulls as it trades in oversold conditions as we wait for a bullish crossover signal to send us higher.
Be the first to know about our price analysis, crypto news and trading tips: Follow us on Telegram or subscribe to our weekly newsletter.
Source: cryptopotato.com
View original post


