
Etherium Price AnalysisPrice Analysis
Ethereum Price Analysis: ETH Pulls Back To $186, Can The Bulls Keep Up?
Ethereum saw a small decline of around 1.5% over the past 24 hours and it currently trades at $186. Over the past week, the cryptocurrency increased by over 7.5% before the recent price fall. Despite the small decrease, Ethereum is still up by a total of 4.5% over the last 30 days as it continues to make higher highs and higher lows during October.
Ethereum remains the third-largest cryptocurrency with a market cap of $20.17 billion.
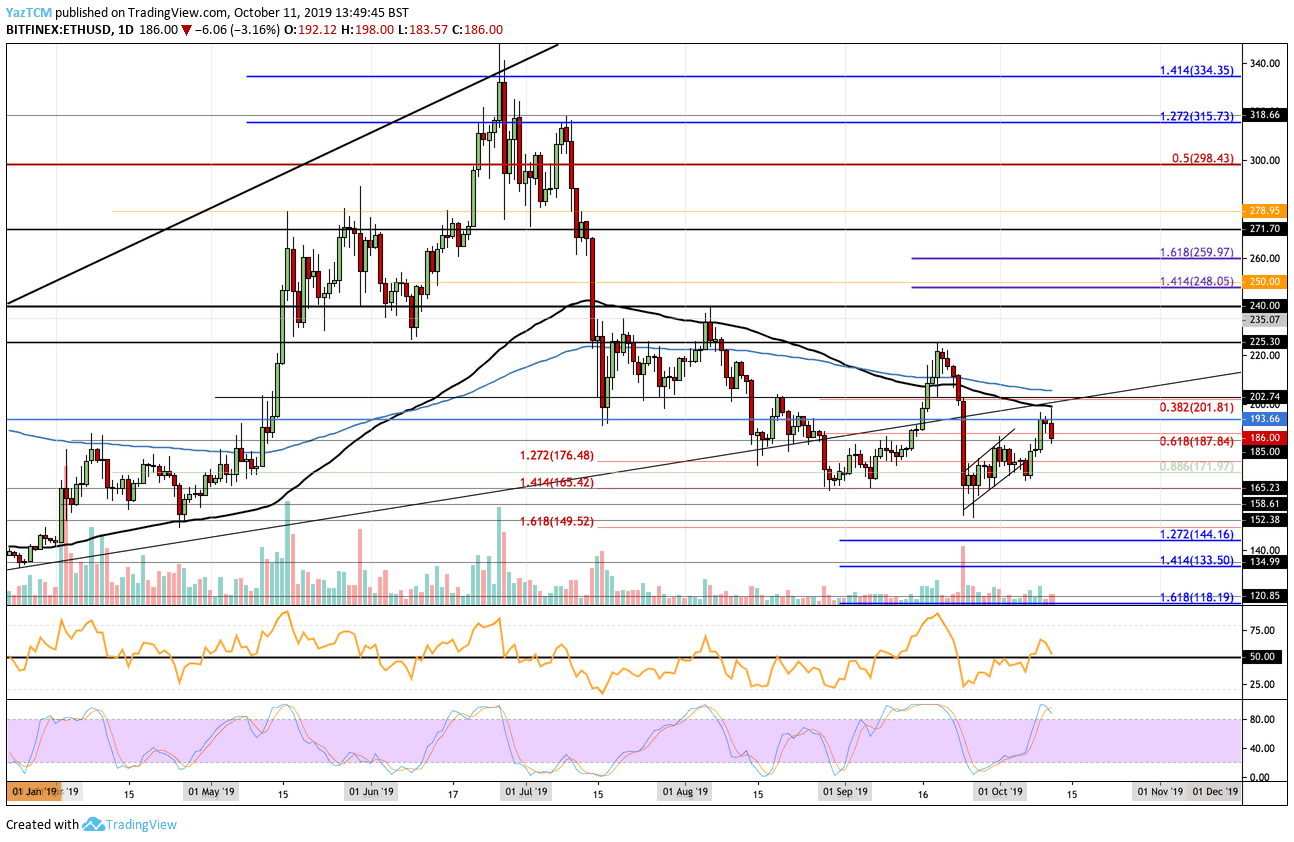
Looking at the ETH/USD 1-day chart:
- Since our last ETH/USD analysis, Ethereum continued to rise beyond the previously highlighted short term ascending price channel. The cryptocurrency managed to rise as high as $193.66 before meeting resistance at the 100-day EMA and rolling over.
- From above: The nearest levels of resistance lie at $193.66 and $200 (100-days EMA). Above this, resistance lies at $203 (200-days EMA), $210, $220, $225. Above $225, resistance is expected at $235, $240, $248, and $260.
- From below: The nearest level of support lies at $185. Beneath this, support can be found at $176.48, $172, $170, and $165.42 (the low day closing price for September). Lower support can be located at $160, $158.61, and $152.
- The trading volume remains very low.
- The RSI is trading at the 50 level which shows indecision within the market. If the RSI can rebound at 50, we can expect the bulls to remain in charge of the market momentum. Furthermore, the Stocahstic RSI has produced a bearish crossover signal in overbought conditions which shows that a retracement is certainly on the cards.
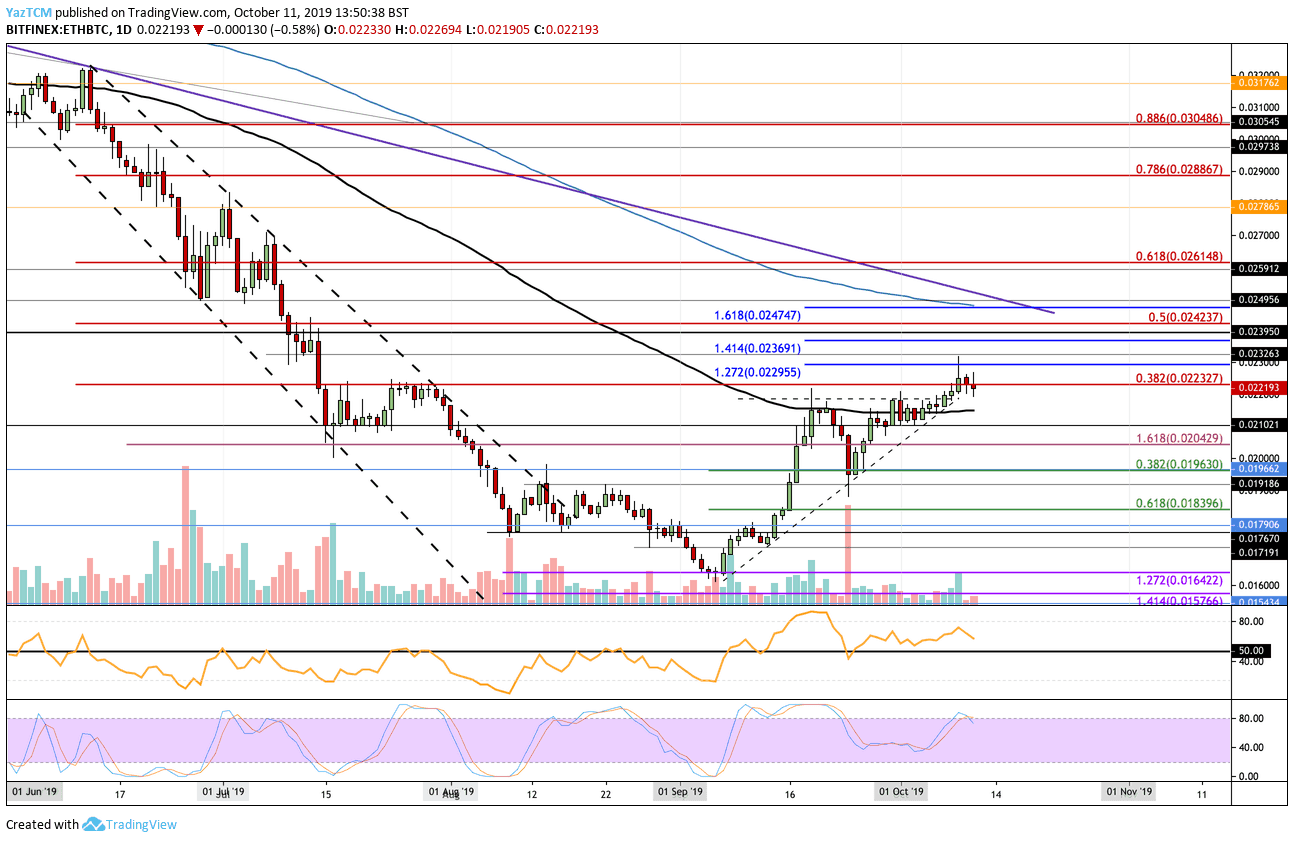
Looking at the ETH/BTC 1-day chart:
- Against BTC, ETH has continued to remain strong and increase slightly. The cryptocurrency had formed an ascending triangle during late-September/early-October and has recently managed to penetrate above the upper boundary. ETH climbed higher to meet resistance at around 0.023 BTC before falling.
- From above: The nearest level of resistance lies at 0.02232 BTC (.382 Fib Retracement). Above this, resistance lies at 0.02295 BTC, 0.02326 BTC, 0.02369 BTC, and 0.02390 BTC. Higher resistance lies at 0.02423 (bearish .5 Fib Retracement) and $0.02474 (200-days EMA).
- From below: The nearest level of support lies at 0.022 BTC. Beneath this, support lies at 0.0215 BTC (100-days EMA), 0.021 BTC, 0.0204 BTC, and 0.020 BTC. Beneath 0.02, support lies at 0.01963 BTC and 0.019 BTC.
- The trading volume remains low.
- The RSI is above the 50 level which shows that the bulls are in charge of the market momentum, however, it is pointing down which shows that the bullish pressure may be fading.
Be the first to know about our price analysis, crypto news and trading tips: Follow us on Telegram or subscribe to our weekly newsletter.
Source: cryptopotato.com
View original post


