
Bitcoin’s Bullish Recovery? BTC Price Facing Its First Significant Test Right Now
After creating another leg down that marked another new low since this bear move started, Bitcoin showing signs of recovery.
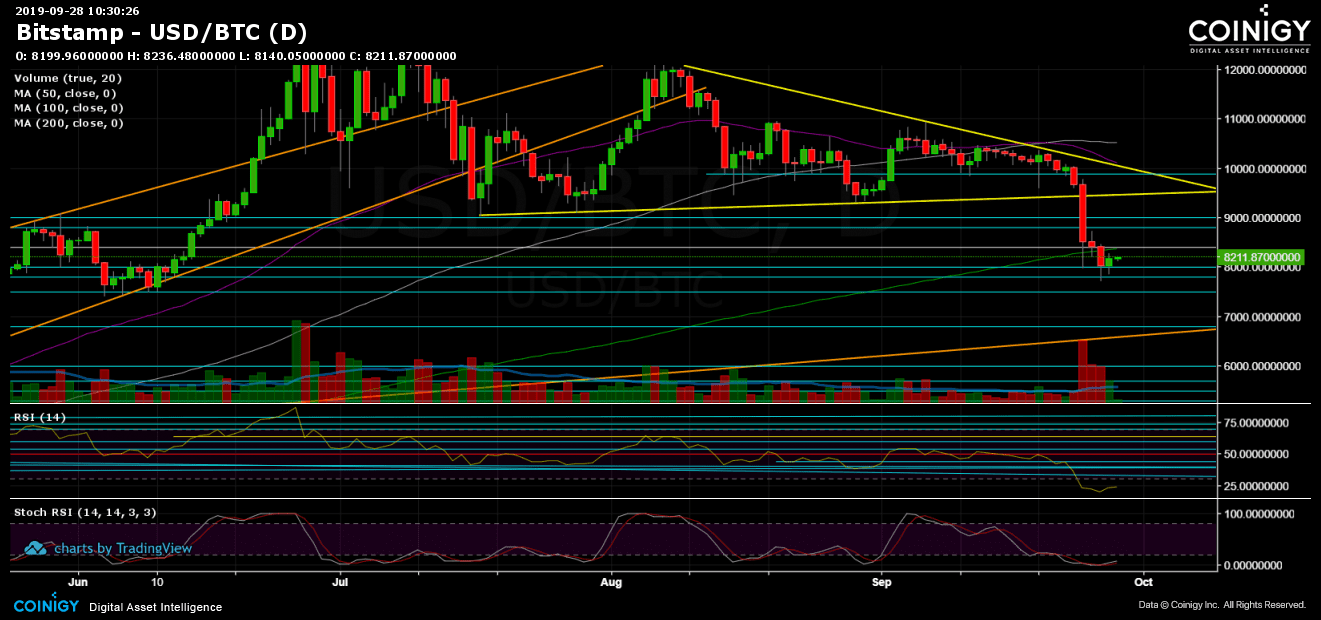
Despite the above, Bitcoin is currently getting close to its real major test, which is the 200-days moving average line (marked light green on the following daily chart). That line is considered, by many, the ultimate barometer of the market.
If the price is traded above – then the bulls are in control of the market and vice versa. On April 2nd, 2019, Bitcoin made a huge daily price surge of 20%, starting the day at $4000, breaking up the $5000 mark along with the 200-days MA line in one decent green candle. The breakout was so strong that since then Bitcoin never saw the $4K prefix again as well as trading below or even near the 200-days MA.
Yesterday was the first daily close below the 200-MA since April 1st. This can turn quickly into a bear market. However, Bitcoin is showing some signs of recovery and might prove that this was a fake-out, for the sake of the bulls.
Total Market Cap: $218 billion
Bitcoin Market Cap: $148 billion
BTC Dominance Index: 67.8%
*Data by CoinGecko
Key Levels to Watch
– Support/Resistance:
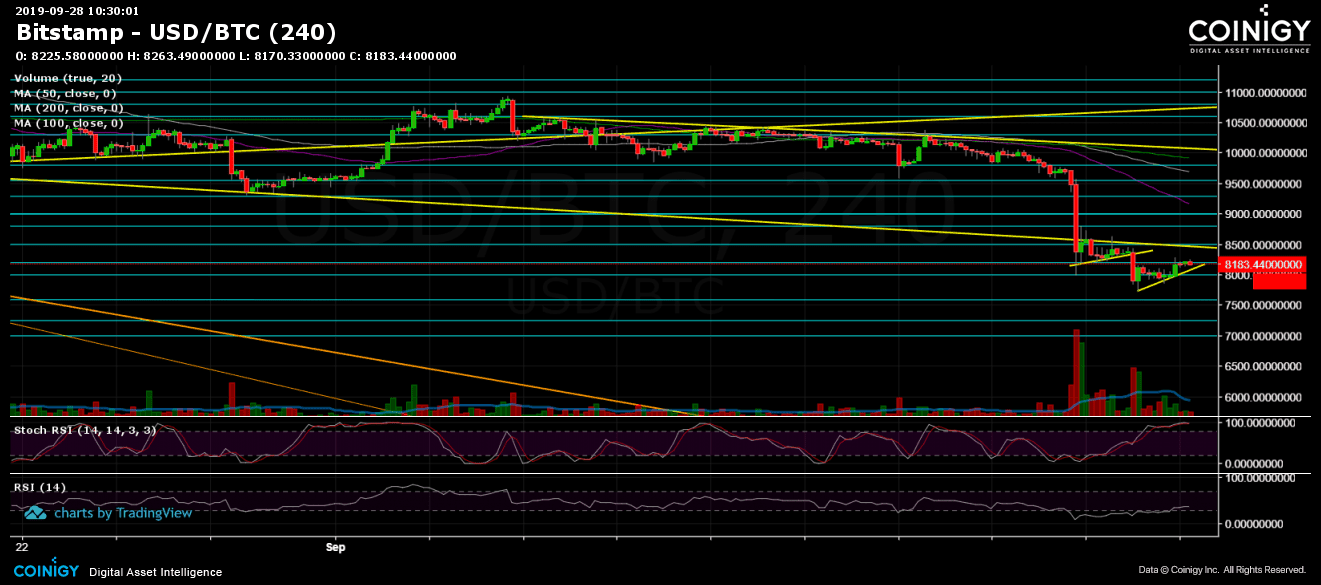
After a day of consolidation around the $8000 support mark, Bitcoin finally shows some respect to the bulls, with a decent move to the $8300. However, the later support turned resistance couldn’t get breached, and after rejecting, the coin is trading steadily around $8200.
A break of $8300 is likely to lead to $8390 where currently lies the 200-days MA line. If Bitcoin succeeds in closing (daily) above the MA-200, the bulls might start to think positive again. The next obstacles are the support turned resistance levels of $8500 – $8600 and further above at $9000 and $9400. To get back on the longer-term bullish track, there must be a move back to the triangle area above $9400 (and not test and get rejected).
From the bearish side, the first level of support is $8000. Further below is the current move’s low at $7733, before the next support of $7600. Down below is $7200, which is also the Fibonacci level of 61.8% since reaching the 2019 high last June.
– The RSI Indicator (Daily): After reaching overextended RSI areas for the first time since November 2018, the RSI is showing a little recovery. However, the indicator is still overextended in the oversold territory. This might support a further correction to the upside.
– The Trading Volume: The huge selling volume is declining over the past days, the sellers’ power is decreasing; but they are still around, and the danger is not over yet.
BTC/USD BitStamp 4-Hour Chart
BTC/USD BitStamp 1-Day Chart
Source: cryptopotato.com
View original post


