Ripple Price Analysis
Ripple Price Analysis: Could XRP’s Recent Sideways Action Culminate in a Powerful Move?
Ripple’s XRP has been fairly stagnant this past week after ‘suffering’ a small 4% price decline, bringing the price of XRP down to $0.2694 at the time of writing.
The cryptocurrency’s price has fallen 15% in the past 30 days with a further 37% drop over the previous 90 days, despite the rising price of Bitcoin. XRP remains the third-largest cryptocurrency by market value, with a market cap of $11.56 billion.
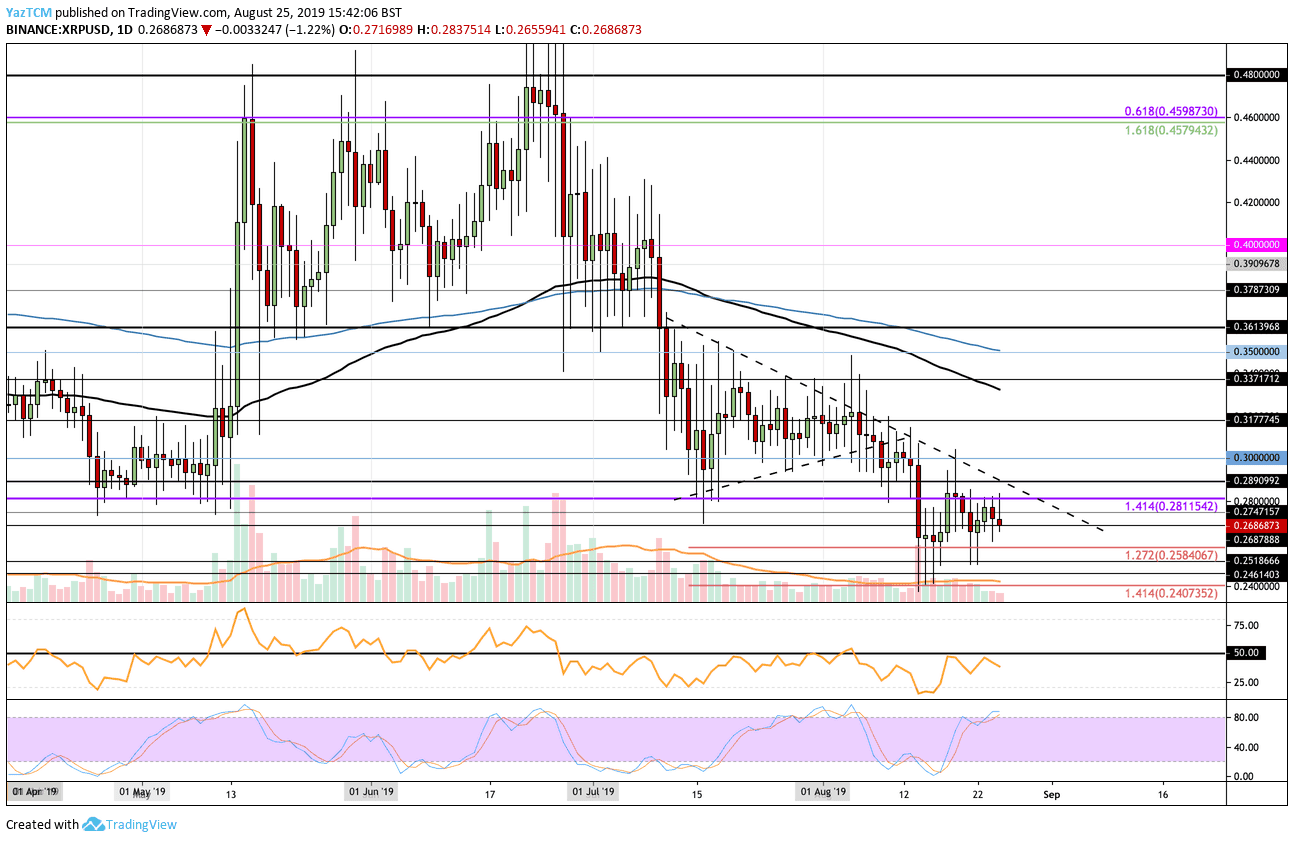
Looking at the XRP/USD 1-day chart:
- Since our previous XRP/USD analysis, XRP has been moving sideways. The coin attempted to break $0.30 but was rejected and fell back beneath $0.28.
- From above: The nearest levels of significant resistance lie at $0.2811 and $0.30. Higher resistance lies at $0.3177 and $0.33. The resistance at $0.33 is strengthened by the 100-day EMA. Additional resistance lies at $0.34 and $0.25 (the 200-day EMA).
- From below: The nearest level of support is the current price of around $0.2686. Beneath this, further support can be found at $0.26, $0.2584, $0.25 and $0.2461.
- The trading volume has remained below average.
- The RSI failed in its previous two attempts to break above 50, which shows that the sellers remain in control. Furthermore, the Stochastic RSI recently entered overbought territory and is primed for a bearish crossover signal which would likely signal a short-term move lower.
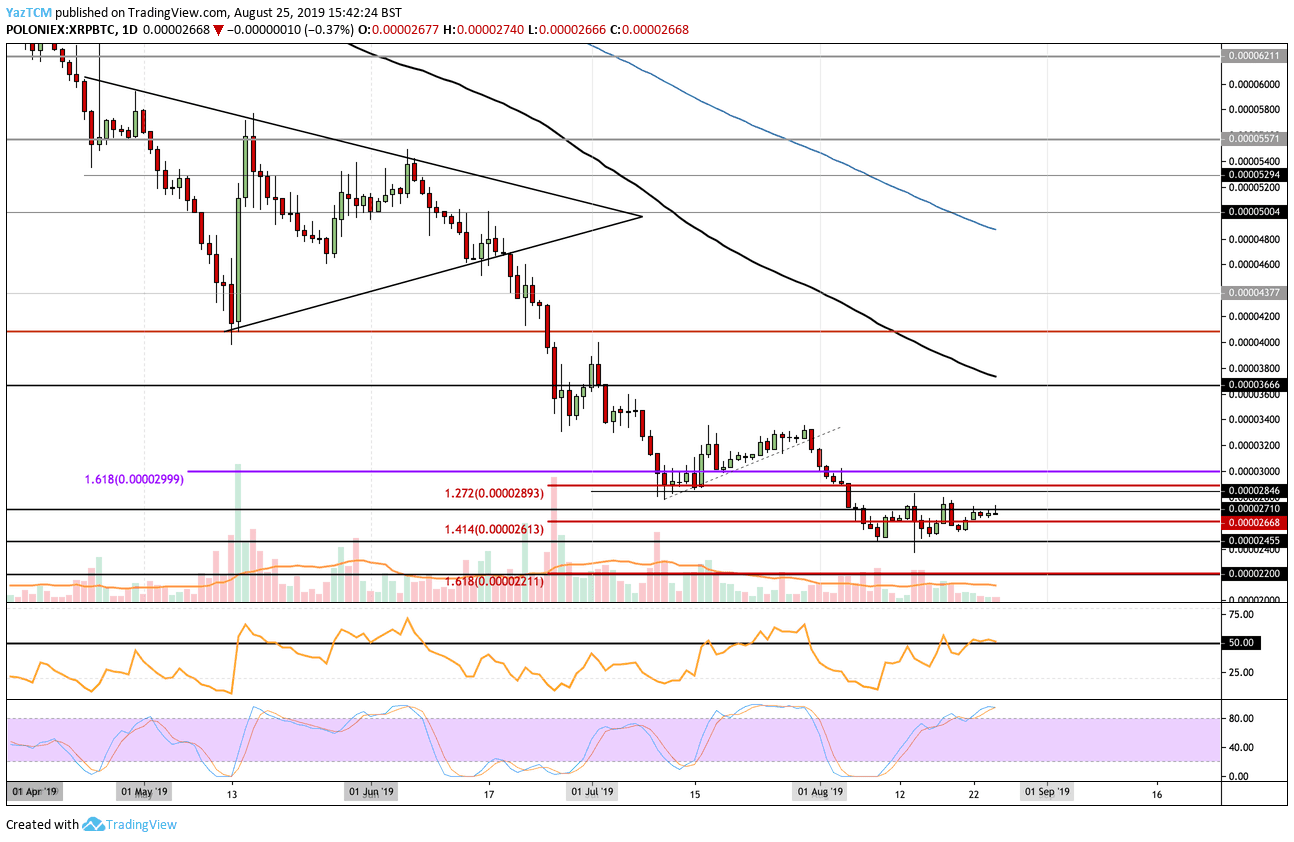
Looking at the XRP/BTC 1-Day Chart:
- Trading against Bitcoin, XRP has somewhat stabilized as it continues to move sideways. The coin is ‘trapped’ within a well-defined range between 2,455 satoshi and 2,800 sat.
- From above: The nearest levels of resistance are 2,710 sat, 2,800 sat and 3,000 sat. Higher resistance lies at 3,200 sat, 3,400 sat and 3,800 sat. The 100-day EMA strengthens the resistance at 3,800 sat.
- From below: The nearest levels of support are 2,668 sat and 2,455 sat. Beneath this, further support can be found at 2,200 sat.
- The current RSI is 50, which is a promising sign for the XRP bulls. If the RSI can break above 50, this will indicate that the bulls are in control of this market. However, the Stochastic RSI is also primed for a bearish crossover signal which would move the market lower.
Be the first to know about our price analysis, crypto news and trading tips: Follow us on Telegram or subscribe to our weekly newsletter.
Source: cryptopotato.com
View original post