
Bitcoin Price Analysis: BTC Shows Strength Following Bakkt News; Last Buy Opportunity Below $10,000?
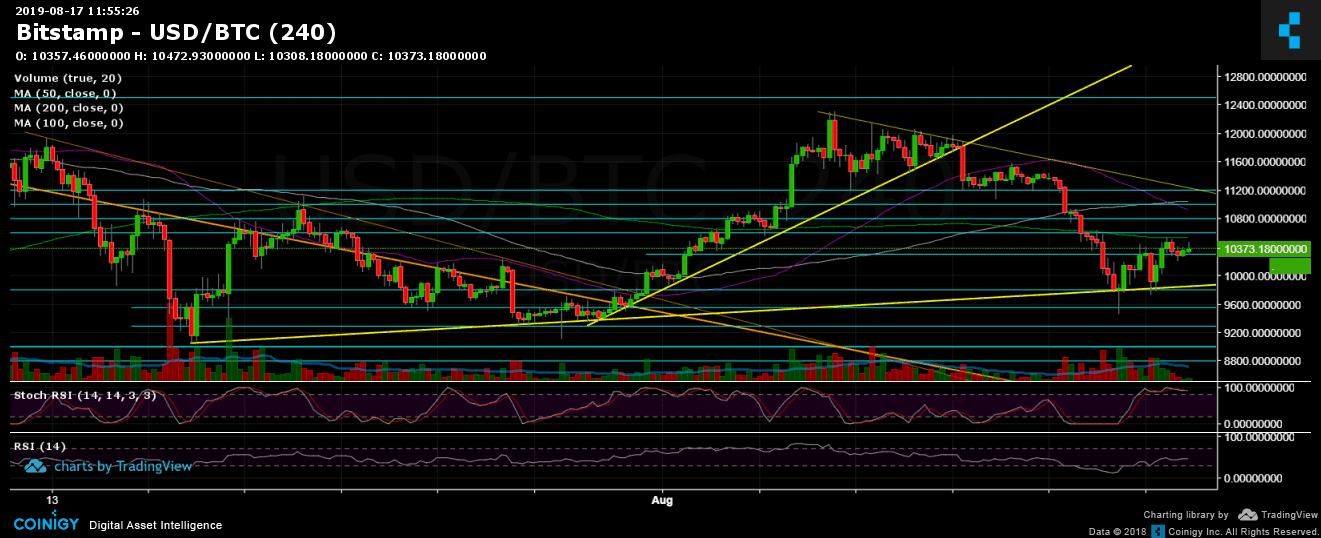
In our last Bitcoin price analysis, we mentioned the ‘last hope’ for Bitcoin. Good news for the bulls: the Doji candle on the 4-hour chart kept the price above the significant 4-hour ascending trend line (marked in bold yellow below).
The following day, we saw Bitcoin retest the line, finding support after the significant news regarding the Bakkt launch date. The news could be a game-changer for Bitcoin in its quest for long-term mass adoption.
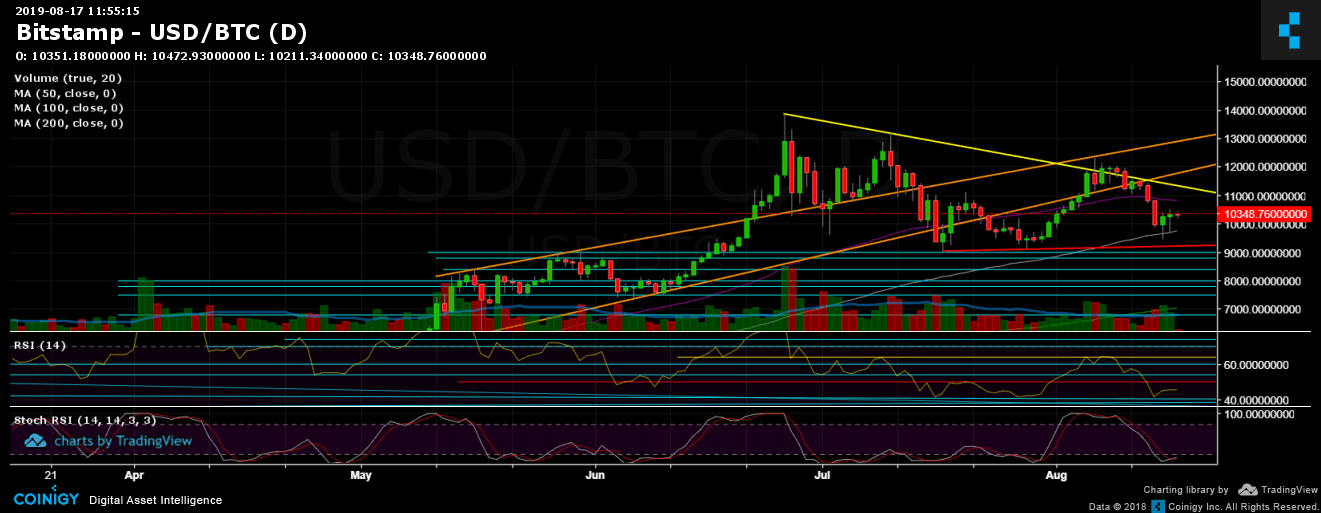
Bitcoin recovered nicely; however, until producing a higher high on the daily chart – which Bitcoin failed to do in its last attempt around $12,000 – the situation is still neutral and fragile in the short term.
Another thing to note is the range Bitcoin is trading in: from above, the MA-200 (marked in light green on the 4-hour chart) and from below, the 100-day moving average line (marked in white on the daily chart) along with the previously mentioned ascending trend line.
Total Market Cap: $268 billion
Bitcoin Market Cap: $185 billion
BTC Dominance Index: 69.1% (Again close to 70%)
*Data from CoinGecko
Key Levels to Watch
Support/Resistance: The nearest resistance now lies around $10,550 (the MA-200 light green line on the 4-hour chart). Further above is $10,800 along with the 50-day moving average line (marked in purple). In the case of a break up, we can expect $11,000-$11,200 to be the next significant short-term resistance level. The latter also contains the descending trend line which started forming around the time of the 2019 high of $13,880.
From below, the nearby area of $10,200-$10,300 is the first line of support. Further below are $10,000, $9,800 (the 100-day moving average line), $9,600 and $9,400 (the weekly low).
Daily chart’s RSI: The RSI indicator found support at 40. As of now, the RSI is around 45, still in bearish territory under 50. However, positive sentiment might come from the Stochastic RSI oscillator, which made a crossover in oversold territory and is about to enter the bullish zone.
Trading Volume: The reversal candle from two days ago turned out to be the highest volume day since July 18. This could be a bullish sign of a possible green continuation.
BTC/USD Bitstamp 4-Hour Chart
BTC/USD Bitstamp 1-Day Chart
Source: cryptopotato.com
View original post


